Singapore Airlines 2014 Annual Report Download - page 88
Download and view the complete annual report
Please find page 88 of the 2014 Singapore Airlines annual report below. You can navigate through the pages in the report by either clicking on the pages listed below, or by using the keyword search tool below to find specific information within the annual report.-
 1
1 -
2
-
3
-
4
-
5
-
6
-
7
-
8
-
9
-
10
-
11
-
12
-
13
-
14
-
15
-
16
-
17
-
18
-
19
-
20
-
21
-
22
-
23
-
24
-
25
-
26
-
27
-
28
-
29
-
30
-
31
-
32
-
33
-
34
-
35
-
36
-
37
-
38
-
39
-
40
-
41
-
42
-
43
-
44
-
45
-
46
-
47
-
48
-
49
-
50
-
51
-
52
-
53
-
54
-
55
-
56
-
57
-
58
-
59
-
60
-
61
-
62
-
63
-
64
-
65
-
66
-
67
-
68
-
69
-
70
-
71
-
72
-
73
-
74
-
75
-
76
-
77
-
 78
78 -
 79
79 -
 80
80 -
 81
81 -
 82
82 -
 83
83 -
 84
84 -
 85
85 -
 86
86 -
 87
87 -
 88
88 -
 89
89 -
 90
90 -
 91
91 -
 92
92 -
 93
93 -
 94
94 -
 95
95 -
 96
96 -
 97
97 -
 98
98 -
99
-
100
-
101
-
102
-
103
-
104
-
105
-
106
-
107
-
108
-
109
-
110
-
111
-
112
-
113
-
114
-
115
-
116
-
117
-
118
-
119
-
120
-
121
-
122
-
123
-
124
-
125
-
126
-
127
-
128
-
129
-
130
-
131
-
132
-
133
-
134
-
135
-
136
-
137
-
138
-
139
-
140
-
141
-
142
-
143
-
144
-
145
-
146
-
147
-
148
-
149
-
150
-
151
-
152
-
153
-
154
-
155
-
156
-
157
-
158
-
159
-
160
-
161
-
162
-
163
-
164
-
165
-
166
-
167
-
168
-
169
-
170
-
171
-
172
-
173
-
174
-
175
-
176
-
177
-
178
-
179
-
180
-
181
-
182
-
183
-
184
-
185
-
186
-
187
-
188
-
189
-
190
-
191
-
192
-
193
-
194
-
195
-
196
-
197
-
198
-
199
-
200
-
201
-
202
-
203
-
204
-
205
-
206
-
207
-
208
-
209
-
210
-
211
-
212
-
213
-
214
-
215
-
216
-
217
-
218
-
219
-
220
 |
 |

086
SINGAPORE AIRLINES
Performance of the Subsidiary Companies (continued)
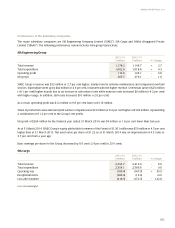
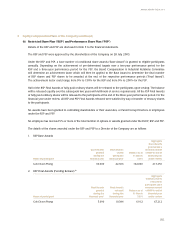
SIA Cargo (continued)
SIA Cargo’s revenue declined $166 million (-6.9 per cent) largely due to weaker yields and reduction in loads. Expenditure
decreased $233 million (-9.0 per cent) in tandem with the reduction in capacity. This translated to an operating loss of
$100 million for 2013/14, an improvement of $67 million as compared to a year ago.
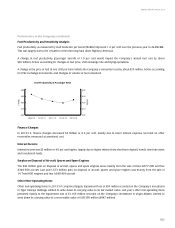
In 2013/14, cargo capacity (in capacity tonne kilometers) dropped 3.6 per cent as a result of rationalisation effort in response to
the continued weak demand, while overall cargo traffic (in load tonne kilometers) dropped 5.1 per cent, resulting in a decline in
cargo load factor by 0.9 percentage point to 62.5 per cent. Cargo breakeven load factor decreased by 2.5 percentage points to
67.0 per cent due to lower unit cost (-5.6 per cent), partially offset by weaker yields (-2.1 per cent).
During the financial year, the exceptional items pertained to an impairment loss of $293.4 million on surplus freighters that
have been removed from the operating fleet, provisions for settlement between SIA Cargo and the plaintiffs in the United
States air cargo class action for USD62.8 million ($78.3 million) and the Australian air cargo class action for AUD5.6 million
($6.4 million), as well as penalties and costs of CHF1.7 million ($2.3 million) imposed by the Swiss Competition Commission in
respect of the air cargo issues.
As at 31 March 2014, SIA Cargo operated a fleet of eight B747-400 freighters. SIA Cargo’s equity was $889 million (-32.1 per cent).
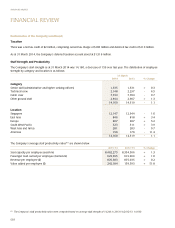
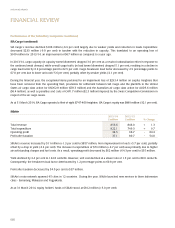
SilkAir
2013/14 2012/13
$million $million %Change
Total revenue 856.6 846.0 + 1.3
Total expenditure 822.1 749.3 + 9.7
Operating profit 34.5 96.7 - 64.3
Profit after taxation 37.1 80.7 - 54.0
SilkAir’s revenue increased by $11 million (+1.3 per cent) to $857 million, from improvement in load (+5.7 per cent), partially
offset by a drop in yield (-3.4 per cent). The increase in expenditure of $73 million (+9.7 per cent) was primarily due to higher
aircraft standing charges and fuel costs. As a result, operating profit decreased by $62 million (-64.3 per cent) to $35 million.
Yield declined by 3.4 per cent to 144.8 cents/ltk. However, unit cost declined at a slower rate of 1.5 per cent to 88.0 cents/ctk.
Consequently, the breakeven load factor deteriorated by 1.2 percentage points to 60.8 per cent.
Profit after taxation decreased by 54.0 per cent to $37 million.
SilkAir’s route network spanned 45 cities in 12 countries. During the year, SilkAir launched new services to three Indonesian
cities - Semarang, Makassar and Yogyakarta.
As at 31 March 2014, equity holders’ funds of SilkAir stood at $812 million (+5.0 per cent).
FINANCIAL REVIEW