Singapore Airlines 2014 Annual Report Download - page 80
Download and view the complete annual report
Please find page 80 of the 2014 Singapore Airlines annual report below. You can navigate through the pages in the report by either clicking on the pages listed below, or by using the keyword search tool below to find specific information within the annual report.-
 1
1 -
2
-
3
-
4
-
5
-
6
-
7
-
8
-
9
-
10
-
11
-
12
-
13
-
14
-
15
-
16
-
17
-
18
-
19
-
20
-
21
-
22
-
23
-
24
-
25
-
26
-
27
-
28
-
29
-
30
-
31
-
32
-
33
-
34
-
35
-
36
-
37
-
38
-
39
-
40
-
41
-
42
-
43
-
44
-
45
-
46
-
47
-
48
-
49
-
50
-
51
-
52
-
53
-
54
-
55
-
56
-
57
-
58
-
59
-
60
-
61
-
62
-
63
-
64
-
65
-
66
-
67
-
68
-
69
-
 70
70 -
 71
71 -
 72
72 -
 73
73 -
 74
74 -
 75
75 -
 76
76 -
 77
77 -
 78
78 -
 79
79 -
 80
80 -
 81
81 -
 82
82 -
 83
83 -
 84
84 -
 85
85 -
 86
86 -
 87
87 -
 88
88 -
 89
89 -
 90
90 -
91
-
92
-
93
-
94
-
95
-
96
-
97
-
98
-
99
-
100
-
101
-
102
-
103
-
104
-
105
-
106
-
107
-
108
-
109
-
110
-
111
-
112
-
113
-
114
-
115
-
116
-
117
-
118
-
119
-
120
-
121
-
122
-
123
-
124
-
125
-
126
-
127
-
128
-
129
-
130
-
131
-
132
-
133
-
134
-
135
-
136
-
137
-
138
-
139
-
140
-
141
-
142
-
143
-
144
-
145
-
146
-
147
-
148
-
149
-
150
-
151
-
152
-
153
-
154
-
155
-
156
-
157
-
158
-
159
-
160
-
161
-
162
-
163
-
164
-
165
-
166
-
167
-
168
-
169
-
170
-
171
-
172
-
173
-
174
-
175
-
176
-
177
-
178
-
179
-
180
-
181
-
182
-
183
-
184
-
185
-
186
-
187
-
188
-
189
-
190
-
191
-
192
-
193
-
194
-
195
-
196
-
197
-
198
-
199
-
200
-
201
-
202
-
203
-
204
-
205
-
206
-
207
-
208
-
209
-
210
-
211
-
212
-
213
-
214
-
215
-
216
-
217
-
218
-
219
-
220
 |
 |

078
SINGAPORE AIRLINES
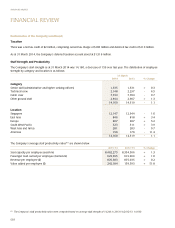
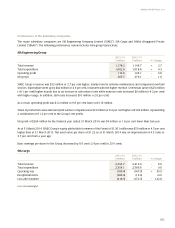
Performance of the Company
Operating Performance
2013/14 2012/13 % Change
Passengers carried (thousand) 18,628 18,210 + 2.3
Available seat-km (million) 120,502.8 118,264.4 + 1.9
Revenue passenger-km (million) 95,064.3 93,765.6 + 1.4
Passenger load factor (%) 78.9 79.3 - 0.4 point
Passenger yield (¢/pkm) 11.1 11.4 - 2.6
Passenger unit cost (¢/ask) 9.1 9.2 - 1.1
Passenger breakeven load factor (%) 82.0 80.7 + 1.3 points
The market environment for the air transportation industry in Asia Pacific remained challenging during the financial year.
Passenger load factor of 78.9 per cent was 0.4 percentage point lower year-on-year, as traffic growth of 1.4 per cent trailed the
capacity expansion of 1.9 per cent.
Promotions launched to boost loads amid the intense competition, and depreciation of major revenue-generating currencies
against the SGD, placed downward pressure on yields, resulting in a 2.6 per cent decline from the previous year.
AvailableSeatCapacity,
Passenger Traffic and Load Factor
Million
120,000
140,000
80,000
100,000
60,000
40,000
20,000
0
Per Cent
81
79
77
85
83
75
Available Seat-km (Million)
Revenue Passenger-km (Million)
Passenger Load Factor (%)
2009/10 2010/11 2011/12 2012/13
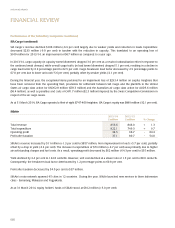
FINANCIAL REVIEW
2013/14