Singapore Airlines 2014 Annual Report Download - page 87
Download and view the complete annual report
Please find page 87 of the 2014 Singapore Airlines annual report below. You can navigate through the pages in the report by either clicking on the pages listed below, or by using the keyword search tool below to find specific information within the annual report.-
 1
1 -
2
-
3
-
4
-
5
-
6
-
7
-
8
-
9
-
10
-
11
-
12
-
13
-
14
-
15
-
16
-
17
-
18
-
19
-
20
-
21
-
22
-
23
-
24
-
25
-
26
-
27
-
28
-
29
-
30
-
31
-
32
-
33
-
34
-
35
-
36
-
37
-
38
-
39
-
40
-
41
-
42
-
43
-
44
-
45
-
46
-
47
-
48
-
49
-
50
-
51
-
52
-
53
-
54
-
55
-
56
-
57
-
58
-
59
-
60
-
61
-
62
-
63
-
64
-
65
-
66
-
67
-
68
-
69
-
70
-
71
-
72
-
73
-
74
-
75
-
76
-
 77
77 -
 78
78 -
 79
79 -
 80
80 -
 81
81 -
 82
82 -
 83
83 -
 84
84 -
 85
85 -
 86
86 -
 87
87 -
 88
88 -
 89
89 -
 90
90 -
 91
91 -
 92
92 -
 93
93 -
 94
94 -
 95
95 -
 96
96 -
 97
97 -
98
-
99
-
100
-
101
-
102
-
103
-
104
-
105
-
106
-
107
-
108
-
109
-
110
-
111
-
112
-
113
-
114
-
115
-
116
-
117
-
118
-
119
-
120
-
121
-
122
-
123
-
124
-
125
-
126
-
127
-
128
-
129
-
130
-
131
-
132
-
133
-
134
-
135
-
136
-
137
-
138
-
139
-
140
-
141
-
142
-
143
-
144
-
145
-
146
-
147
-
148
-
149
-
150
-
151
-
152
-
153
-
154
-
155
-
156
-
157
-
158
-
159
-
160
-
161
-
162
-
163
-
164
-
165
-
166
-
167
-
168
-
169
-
170
-
171
-
172
-
173
-
174
-
175
-
176
-
177
-
178
-
179
-
180
-
181
-
182
-
183
-
184
-
185
-
186
-
187
-
188
-
189
-
190
-
191
-
192
-
193
-
194
-
195
-
196
-
197
-
198
-
199
-
200
-
201
-
202
-
203
-
204
-
205
-
206
-
207
-
208
-
209
-
210
-
211
-
212
-
213
-
214
-
215
-
216
-
217
-
218
-
219
-
220
 |
 |

085
ANNUAL REPORT FY2013/14
Performance of the Subsidiary Companies
The major subsidiary companies are SIA Engineering Company Limited (“SIAEC”), SIA Cargo and SilkAir (Singapore) Private
Limited (“SilkAir”). The following performance review includes intra-group transactions.
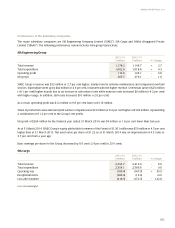
SIA Engineering Group
2013/14 2012/13
$million $million %Change
Total revenue 1,178.2 1,146.7 + 2.7
Total expenditure 1,062.6 1,018.6 + 4.3
Operating profit 115.6 128.1 - 9.8
Net profit 265.7 270.1 - 1.6
SIAEC Group’s revenue was $32 million or 2.7 per cent higher, mainly from its airframe maintenance and component overhaul
services. Expenditure went up by $44 million or 4.3 per cent, in tandem with the higher revenue. Overheads came in $25 million
(+8.1 per cent) higher mainly due to an increase in subcontract costs while material costs increased $9 million (+4.2 per cent)
with higher usage. In addition, staff costs increased $10 million (+2.0 per cent).
As a result, operating profit was $12 million or 9.8 per cent lower at $116 million.
Share of profits from associated and joint venture companies was $13 million or 8.3 per cent higher at $163 million, representing
a contribution of 61.2 per cent to the Group’s net profits.
Net profit of $266 million for the financial year ended 31 March 2014, was $4 million or 1.6 per cent lower than last year.
As at 31 March 2014, SIAEC Group’s equity attributable to owners of the Parent of $1,361 million was $59 million or 4.5 per cent
higher than at 31 March 2013. Net asset value per share of $1.22 as at 31 March 2014 was an improvement of 4.3 cents or
3.7 per cent from a year ago.
Basic earnings per share for the Group decreased by 0.6 cent (-2.4 per cent) to 23.9 cents.
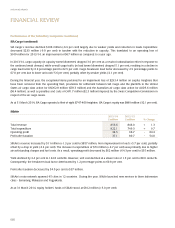
SIA Cargo
2013/14 2012/13
$million $million %Change
Total revenue 2,253.7 2,419.6 - 6.9
Total expenditure 2,354.1 2,586.6 - 9.0
Operating loss (100.4) (167.0) + 39.9
Exceptional items (380.4) (19.9) n.m
Loss after taxation (418.3) (172.3) - 142.8
n.m. not meaningful