Singapore Airlines 2014 Annual Report Download - page 182
Download and view the complete annual report
Please find page 182 of the 2014 Singapore Airlines annual report below. You can navigate through the pages in the report by either clicking on the pages listed below, or by using the keyword search tool below to find specific information within the annual report.-
 1
1 -
2
-
3
-
4
-
5
-
6
-
7
-
8
-
9
-
10
-
11
-
12
-
13
-
14
-
15
-
16
-
17
-
18
-
19
-
20
-
21
-
22
-
23
-
24
-
25
-
26
-
27
-
28
-
29
-
30
-
31
-
32
-
33
-
34
-
35
-
36
-
37
-
38
-
39
-
40
-
41
-
42
-
43
-
44
-
45
-
46
-
47
-
48
-
49
-
50
-
51
-
52
-
53
-
54
-
55
-
56
-
57
-
58
-
59
-
60
-
61
-
62
-
63
-
64
-
65
-
66
-
67
-
68
-
69
-
70
-
71
-
72
-
73
-
74
-
75
-
76
-
77
-
78
-
79
-
80
-
81
-
82
-
83
-
84
-
85
-
86
-
87
-
88
-
89
-
90
-
91
-
92
-
93
-
94
-
95
-
96
-
97
-
98
-
99
-
100
-
101
-
102
-
103
-
104
-
105
-
106
-
107
-
108
-
109
-
110
-
111
-
112
-
113
-
114
-
115
-
116
-
117
-
118
-
119
-
120
-
121
-
122
-
123
-
124
-
125
-
126
-
127
-
128
-
129
-
130
-
131
-
132
-
133
-
134
-
135
-
136
-
137
-
138
-
139
-
140
-
141
-
142
-
143
-
144
-
145
-
146
-
147
-
148
-
149
-
150
-
151
-
152
-
153
-
154
-
155
-
156
-
157
-
158
-
159
-
160
-
161
-
162
-
163
-
164
-
165
-
166
-
167
-
168
-
169
-
170
-
171
-
 172
172 -
 173
173 -
 174
174 -
 175
175 -
 176
176 -
 177
177 -
 178
178 -
 179
179 -
 180
180 -
 181
181 -
 182
182 -
 183
183 -
 184
184 -
 185
185 -
 186
186 -
 187
187 -
 188
188 -
 189
189 -
 190
190 -
 191
191 -
 192
192 -
193
-
194
-
195
-
196
-
197
-
198
-
199
-
200
-
201
-
202
-
203
-
204
-
205
-
206
-
207
-
208
-
209
-
210
-
211
-
212
-
213
-
214
-
215
-
216
-
217
-
218
-
219
-
220
 |
 |
180
NOTES TO THE FINANCIAL STATEMENTS
31 March 2014
SINGAPORE AIRLINES
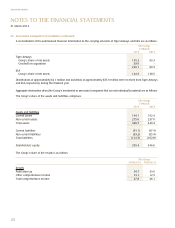
33 Trade and Other Creditors (in $ million)
The Group The Company
31 March 31 March
2014 2013 2014 2013
Trade creditors 2,972.9 3,054.8 2,287.4 2,369.5
Amounts owing to associated companies 5.0 0.9 - -
2,977.9 3,055.7 2,287.4 2,369.5
Funds from subsidiary companies - - 853.2 1,036.2
Amounts owing to subsidiary companies - - 181.6 183.6
- - 1,034.8 1,219.8
2,977.9 3,055.7 3,322.2 3,589.3
Trade and other creditors are non-interest bearing. Amounts owing to related parties are trade-related, unsecured, non-interest
bearing, repayable on demand and are to be settled in cash. As at 31 March 2014, 5.3% (2013: 5.9%) of trade and other
creditors were held in USD by the Group. Included in trade and other creditors are amounts owing to related parties of $177.0
million (2013: $184.5 million) and $127.4 million (2013: $142.9 million) for the Group and Company respectively.
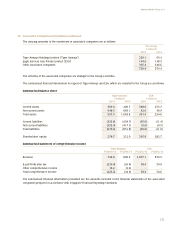
Funds from subsidiary companies are unsecured and have varying repayment terms. Interest on funds from subsidiary
companies are computed using prevailing market rates which range from 0.01% to 0.57% (FY2012/13: 0.01% to 0.56%)
per annum for SGD funds, from 0.03% to 0.48% (FY2012/13: 0.06% to 1.00%) per annum for USD.
As at 31 March 2014, 13% of the funds from subsidiary companies are denominated in USD (2013: USD – 11.0%, AUD
– 0.5%).
Amounts owing to subsidiary and associated companies are unsecured, trade-related, non-interest bearing and are repayable
on demand.
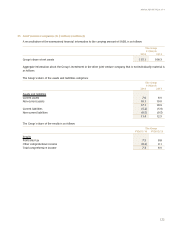
The Company’s amounts owing to subsidiary companies that are off-set are as follows:
The Company
31 March
2014 2013
Gross carrying amounts of payables 1,126.9 1,343.3
Gross amounts offset in the balance sheet of receivables (92.1) (123.5)
Net amounts in the balance sheet 1,034.8 1,219.8
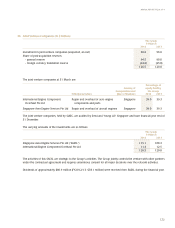
34 Analysis of Capital Expenditure Cash Flow (in $ million)
The Group
FY2013/14 FY2012/13
Purchase of property, plant and equipment 2,593.0 1,896.5
Property, plant and equipment acquired under credit terms (18.4) (21.1)
Cash invested in capital expenditure 2,574.6 1,875.4
Purchase of intangible assets 30.0 83.6
Intangible assets acquired under credit terms (0.3) -
Cash invested in purchase of intangible assets 29.7 83.6