Singapore Airlines 2014 Annual Report Download - page 132
Download and view the complete annual report
Please find page 132 of the 2014 Singapore Airlines annual report below. You can navigate through the pages in the report by either clicking on the pages listed below, or by using the keyword search tool below to find specific information within the annual report.-
 1
1 -
2
-
3
-
4
-
5
-
6
-
7
-
8
-
9
-
10
-
11
-
12
-
13
-
14
-
15
-
16
-
17
-
18
-
19
-
20
-
21
-
22
-
23
-
24
-
25
-
26
-
27
-
28
-
29
-
30
-
31
-
32
-
33
-
34
-
35
-
36
-
37
-
38
-
39
-
40
-
41
-
42
-
43
-
44
-
45
-
46
-
47
-
48
-
49
-
50
-
51
-
52
-
53
-
54
-
55
-
56
-
57
-
58
-
59
-
60
-
61
-
62
-
63
-
64
-
65
-
66
-
67
-
68
-
69
-
70
-
71
-
72
-
73
-
74
-
75
-
76
-
77
-
78
-
79
-
80
-
81
-
82
-
83
-
84
-
85
-
86
-
87
-
88
-
89
-
90
-
91
-
92
-
93
-
94
-
95
-
96
-
97
-
98
-
99
-
100
-
101
-
102
-
103
-
104
-
105
-
106
-
107
-
108
-
109
-
110
-
111
-
112
-
113
-
114
-
115
-
116
-
117
-
118
-
119
-
120
-
121
-
 122
122 -
 123
123 -
 124
124 -
 125
125 -
 126
126 -
 127
127 -
 128
128 -
 129
129 -
 130
130 -
 131
131 -
 132
132 -
 133
133 -
 134
134 -
 135
135 -
 136
136 -
 137
137 -
 138
138 -
 139
139 -
 140
140 -
 141
141 -
 142
142 -
143
-
144
-
145
-
146
-
147
-
148
-
149
-
150
-
151
-
152
-
153
-
154
-
155
-
156
-
157
-
158
-
159
-
160
-
161
-
162
-
163
-
164
-
165
-
166
-
167
-
168
-
169
-
170
-
171
-
172
-
173
-
174
-
175
-
176
-
177
-
178
-
179
-
180
-
181
-
182
-
183
-
184
-
185
-
186
-
187
-
188
-
189
-
190
-
191
-
192
-
193
-
194
-
195
-
196
-
197
-
198
-
199
-
200
-
201
-
202
-
203
-
204
-
205
-
206
-
207
-
208
-
209
-
210
-
211
-
212
-
213
-
214
-
215
-
216
-
217
-
218
-
219
-
220
 |
 |

130
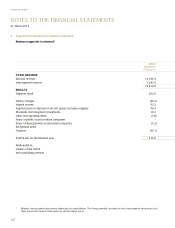
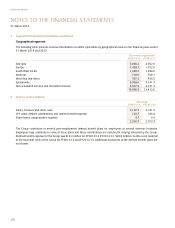
NOTES TO THE FINANCIAL STATEMENTS
31 March 2014
SINGAPORE AIRLINES
3 Significant Accounting Judgments and Estimates (continued)
(b) Key sources of estimation uncertainty (continued)
(i) Impairmentofproperty,plantandequipment–aircrafteet
Impairment is recognised when events and circumstances indicate that the aircraft may be impaired and the
carrying amounts of the aircraft exceed the recoverable amounts. Recoverable amount is defined as the higher of
an aircraft’s fair value less costs to sell and its value-in-use. The fair value less costs to sell computation is based
on available data from binding sales transactions in an arm’s length transaction of similar assets or observable
market prices less incremental costs for disposing the asset. In determining the recoverable amounts of the
aircraft, certain estimates regarding the current fair market value of the aircraft are made. The current fair market
value is determined based on desktop valuations from an independent appraisal for fleet with similar operational
lives. When value-in-use calculations are undertaken, the Group uses discounted cash flow projections based on
financial budgets approved by the Management covering a specified period.
(ii) Depreciationofproperty,plantandequipment–aircrafteet
Aircraft are depreciated on a straight-line basis at rates which are calculated to write down their cost to their
estimated residual values at the end of their operational lives. Certain estimates regarding the operational lives
and residual values of the fleet are made by the Group based on past experience and these are in line with the
industry. The operational lives and residual values are reviewed on an annual basis. The carrying amount of the
Group’s and the Company’s aircraft fleet at 31 March 2014 was $9,788.4 million (2013: $10,546.1 million) and
$8,228.6 million (2013: $8,553.9 million) respectively.
During the year, the Group revised the estimated useful lives of its certain overhaul assets to better reflect the
economic useful life with effect from 1 April 2013. The effect of this change is a reduction in depreciation expense
of approximately $33.8 million for the financial year ended 31 March 2014.
(iii) Passenger revenue recognition
Passenger sales are recognised as operating revenue when the transportation is provided. The value of unused
tickets is included as sales in advance of carriage on the statement of financial position and recognised as revenue
at the end of two years. This is estimated based on historical trends and experiences of the Group whereby ticket
uplift occurs mainly within the first two years. The carrying amount of the Group’s and the Company’s sales in
advance of carriage at 31 March 2014 was $1,446.3 million (2013: $1,434.3 million) and $1,376.4 million
(2013: $1,367.7 million) respectively.
(iv) Frequent Flyer programme
The Company operates a frequent flyer programme called “KrisFlyer” that provides travel awards to programme
members based on accumulated mileage. A portion of passenger revenue attributable to the award of frequent
flyer benefits is deferred until they are utilised. The deferment of the revenue is estimated based on historical
trends of breakage and redemption, which is then used to project the expected utilisation of these benefits.
Any remaining unutilised benefits are recognised as revenue upon expiry. The carrying amount of the Group’s and
the Company’s deferred revenue at 31 March 2014 was $572.9 million (2013: $532.5 million).
During the financial year, the Company introduced the Pay With Miles option to the KrisFlyer programme.
Based on expected higher utilisation, the Company made a downward revision to the estimated breakage rate.
The impact of the revision in estimate is a decrease of $64.0 million in revenue for the financial year ended
31 March 2014.