Singapore Airlines 2014 Annual Report Download - page 178
Download and view the complete annual report
Please find page 178 of the 2014 Singapore Airlines annual report below. You can navigate through the pages in the report by either clicking on the pages listed below, or by using the keyword search tool below to find specific information within the annual report.-
 1
1 -
2
-
3
-
4
-
5
-
6
-
7
-
8
-
9
-
10
-
11
-
12
-
13
-
14
-
15
-
16
-
17
-
18
-
19
-
20
-
21
-
22
-
23
-
24
-
25
-
26
-
27
-
28
-
29
-
30
-
31
-
32
-
33
-
34
-
35
-
36
-
37
-
38
-
39
-
40
-
41
-
42
-
43
-
44
-
45
-
46
-
47
-
48
-
49
-
50
-
51
-
52
-
53
-
54
-
55
-
56
-
57
-
58
-
59
-
60
-
61
-
62
-
63
-
64
-
65
-
66
-
67
-
68
-
69
-
70
-
71
-
72
-
73
-
74
-
75
-
76
-
77
-
78
-
79
-
80
-
81
-
82
-
83
-
84
-
85
-
86
-
87
-
88
-
89
-
90
-
91
-
92
-
93
-
94
-
95
-
96
-
97
-
98
-
99
-
100
-
101
-
102
-
103
-
104
-
105
-
106
-
107
-
108
-
109
-
110
-
111
-
112
-
113
-
114
-
115
-
116
-
117
-
118
-
119
-
120
-
121
-
122
-
123
-
124
-
125
-
126
-
127
-
128
-
129
-
130
-
131
-
132
-
133
-
134
-
135
-
136
-
137
-
138
-
139
-
140
-
141
-
142
-
143
-
144
-
145
-
146
-
147
-
148
-
149
-
150
-
151
-
152
-
153
-
154
-
155
-
156
-
157
-
158
-
159
-
160
-
161
-
162
-
163
-
164
-
165
-
166
-
167
-
 168
168 -
 169
169 -
 170
170 -
 171
171 -
 172
172 -
 173
173 -
 174
174 -
 175
175 -
 176
176 -
 177
177 -
 178
178 -
 179
179 -
 180
180 -
 181
181 -
 182
182 -
 183
183 -
 184
184 -
 185
185 -
 186
186 -
 187
187 -
 188
188 -
189
-
190
-
191
-
192
-
193
-
194
-
195
-
196
-
197
-
198
-
199
-
200
-
201
-
202
-
203
-
204
-
205
-
206
-
207
-
208
-
209
-
210
-
211
-
212
-
213
-
214
-
215
-
216
-
217
-
218
-
219
-
220
 |
 |

176
NOTES TO THE FINANCIAL STATEMENTS
31 March 2014
SINGAPORE AIRLINES
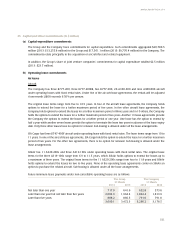
26 Long-TermInvestments(in$million)
The Group The Company
31 March 31 March
2014 2013 2014 2013
Available-for-sale investments
Quoted
Government securities 0.6 0.5 0.6 0.5
Equity investments 315.3 132.0 315.3 132.0
Unquoted
Non-equity investments 293.6 123.5 293.6 123.5
Equity investments, at cost 108.1 108.1 28.0 28.0
Accumulated impairment loss (9.2) (9.2) (9.2) (9.2)
708.4 354.9 628.3 274.8
Held-to-maturity investments
Quoted non-equity investments 243.5 222.4 243.5 222.4
Unquoted non-equity investments 173.3 129.6 173.3 129.6
416.8 352.0 416.8 352.0
1,125.2 706.9 1,045.1 626.8
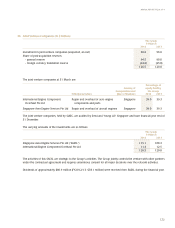
The Group’s non-equity investments comprise investments in corporate bonds, credit-linked notes, fixed-rate notes and
investment funds.
The interest rate for quoted government securities is 7.00% (FY2012/13: 7.00%) per annum. The interest rates for quoted
and unquoted non-equity investments range from 2.37% to 4.65% (FY2012/13: 2.63% to 5.60%) per annum and 2.55%
to 4.02% (FY2012/13: 2.28% to 4.02%) per annum respectively.
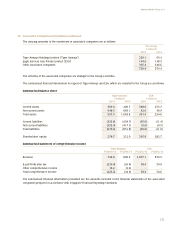
During the financial year, the Company acquired additional shares in Virgin Australia and consequently increased its
interest to 20.8% as at 31 March 2014. The Company also entered into an equity derivative representing an additional
interest of 1.34% of shares in Virgin Australia. The derivative is a share purchase option which confers no ownership rights
or carries any voting rights and has been recognised within the derivative assets in the statements of financial position.
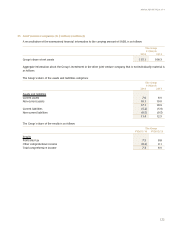
27 Other Receivables (in $ million)
The Group’s other receivables are stated at amortised cost and are expected to be received over a period of two to three
years. The entire balance of other receivables is denominated in USD.
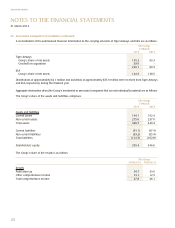
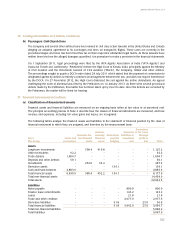
28 Inventories (in $ million)
The Group The Company
31 March 31 March
2014 2013 2014 2013
Technical stocks and stores 215.8 248.5 150.4 173.9
Catering and general stocks 27.2 26.4 18.8 18.8
Total inventories at lower of cost and net realisable value 243.0 274.9 169.2 192.7
The cost of inventories recognised as an expense amounts to $115.5 million (FY2012/13: $102.9 million). In addition,
the Group wrote down $22.3 million (FY2012/13: $32.3 million) of inventories, which is recognised as other operating
expenses in the profit and loss account.