Singapore Airlines 2014 Annual Report Download - page 75
Download and view the complete annual report
Please find page 75 of the 2014 Singapore Airlines annual report below. You can navigate through the pages in the report by either clicking on the pages listed below, or by using the keyword search tool below to find specific information within the annual report.-
 1
1 -
 2
2 -
 3
3 -
 4
4 -
 5
5 -
 6
6 -
 7
7 -
 8
8 -
 9
9 -
 10
10 -
 11
11 -
 12
12 -
 13
13 -
 14
14 -
 15
15 -
 16
16 -
 17
17 -
 18
18 -
 19
19 -
 20
20 -
 21
21 -
 22
22 -
 23
23 -
 24
24 -
 25
25 -
 26
26 -
 27
27 -
 28
28 -
 29
29 -
 30
30 -
 31
31 -
 32
32 -
 33
33 -
 34
34 -
 35
35 -
 36
36 -
 37
37 -
 38
38 -
 39
39 -
 40
40 -
 41
41 -
 42
42 -
 43
43 -
 44
44 -
 45
45 -
 46
46 -
 47
47 -
 48
48 -
 49
49 -
 50
50 -
 51
51 -
 52
52 -
 53
53 -
 54
54 -
 55
55 -
 56
56 -
 57
57 -
 58
58 -
 59
59 -
 60
60 -
 61
61 -
 62
62 -
 63
63 -
 64
64 -
 65
65 -
 66
66 -
 67
67 -
 68
68 -
 69
69 -
 70
70 -
 71
71 -
 72
72 -
 73
73 -
 74
74 -
 75
75 -
 76
76 -
 77
77 -
 78
78 -
 79
79 -
 80
80 -
 81
81 -
 82
82 -
 83
83 -
 84
84 -
 85
85 -
 86
86 -
 87
87 -
 88
88 -
 89
89 -
 90
90 -
 91
91 -
 92
92 -
 93
93 -
 94
94 -
 95
95 -
 96
96 -
 97
97 -
 98
98 -
 99
99 -
 100
100 -
 101
101 -
 102
102 -
 103
103 -
 104
104 -
 105
105 -
 106
106 -
 107
107 -
 108
108 -
 109
109 -
 110
110 -
 111
111 -
 112
112 -
 113
113 -
 114
114 -
 115
115 -
 116
116 -
 117
117 -
 118
118 -
 119
119 -
 120
120 -
 121
121 -
 122
122 -
 123
123 -
 124
124 -
 125
125 -
 126
126 -
 127
127 -
 128
128 -
 129
129 -
 130
130 -
 131
131 -
 132
132 -
 133
133 -
 134
134 -
 135
135 -
 136
136 -
 137
137 -
 138
138 -
 139
139 -
 140
140 -
 141
141 -
 142
142 -
 143
143 -
 144
144 -
 145
145 -
 146
146 -
 147
147 -
 148
148 -
 149
149 -
 150
150 -
 151
151 -
 152
152 -
 153
153 -
 154
154 -
 155
155 -
 156
156 -
 157
157 -
 158
158 -
 159
159 -
 160
160 -
 161
161 -
 162
162 -
 163
163 -
 164
164 -
 165
165 -
 166
166 -
 167
167 -
 168
168 -
 169
169 -
 170
170 -
 171
171 -
 172
172 -
 173
173 -
 174
174 -
 175
175 -
 176
176 -
 177
177 -
 178
178 -
 179
179 -
 180
180 -
 181
181 -
 182
182 -
 183
183 -
 184
184 -
 185
185 -
 186
186 -
 187
187 -
 188
188 -
 189
189 -
 190
190 -
 191
191 -
 192
192 -
 193
193 -
 194
194 -
 195
195 -
 196
196 -
 197
197 -
 198
198 -
 199
199 -
 200
200 -
 201
201 -
 202
202 -
 203
203 -
 204
204 -
 205
205 -
 206
206 -
 207
207 -
 208
208 -
 209
209 -
 210
210 -
 211
211 -
 212
212 -
 213
213 -
 214
214 -
 215
215 -
 216
216 -
 217
217 -
 218
218 -
 219
219 -
 220
220
 |
 |

073
ANNUAL REPORT FY2013/14
Quarterly Trend of Group Fuel Price
and Fuel Cost (excluding hedging)
1,600 150
1,400
120
1,200
1,000 90
$ Million
USD/BBL
Group Expenditure
Performance of the Group (continued)
Group Earnings (continued)
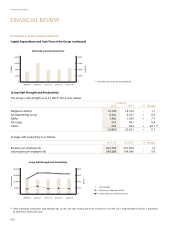
Group expenditure increased by $116 million (+0.8 per cent) to $14,985 million, primarily from higher rentals on leased aircraft
and ex-fuel variable costs, partly mitigated by a lower fuel bill. Rentals on leased aircraft increased as there were more aircraft
on lease while the increase in ex-fuel variable costs, such as aircraft maintenance and overhaul costs, passenger costs and
handling charges, was largely driven by the capacity expansion during the financial year. Fuel cost fell mainly from lower fuel
prices, partially offset by stronger USD against SGD and higher fuel volume uplifted.
Consequently, the Group’s operating profit improved $30 million to $259 million for the financial year ended 31 March
2014. Except for Singapore Airlines (“the Company”) and Singapore Airlines Cargo (“SIA Cargo”), operating performance for
all the major companies in the Group deteriorated from the preceding year. The Company recorded an operating profit of
$256 million in the financial year, an improvement of $69 million (+36.5 per cent) from a year ago. SIA Cargo narrowed its
operating loss by $67 million year-on-year, largely attributable to its capacity rationalisation effort in response to the continued
weak air freight demand. Please refer to the review of the Company and subsidiary companies for further details.
Fuel Costs
After Hedging
Depreciation and
Lease Rentals
Handling Charges
Staff Costs
Passenger Costs
Others
15.6%
15.0%
19.6%
4.8%
6.9%
38.1%
2013/14
Q4
2012/13
Q1
2012/13
Q2
2012/13
Q3
2012/13
Q4
2013/14
Q1
2013/14
Q2
2013/14
Q3
