Singapore Airlines 2014 Annual Report Download - page 181
Download and view the complete annual report
Please find page 181 of the 2014 Singapore Airlines annual report below. You can navigate through the pages in the report by either clicking on the pages listed below, or by using the keyword search tool below to find specific information within the annual report.-
 1
1 -
2
-
3
-
4
-
5
-
6
-
7
-
8
-
9
-
10
-
11
-
12
-
13
-
14
-
15
-
16
-
17
-
18
-
19
-
20
-
21
-
22
-
23
-
24
-
25
-
26
-
27
-
28
-
29
-
30
-
31
-
32
-
33
-
34
-
35
-
36
-
37
-
38
-
39
-
40
-
41
-
42
-
43
-
44
-
45
-
46
-
47
-
48
-
49
-
50
-
51
-
52
-
53
-
54
-
55
-
56
-
57
-
58
-
59
-
60
-
61
-
62
-
63
-
64
-
65
-
66
-
67
-
68
-
69
-
70
-
71
-
72
-
73
-
74
-
75
-
76
-
77
-
78
-
79
-
80
-
81
-
82
-
83
-
84
-
85
-
86
-
87
-
88
-
89
-
90
-
91
-
92
-
93
-
94
-
95
-
96
-
97
-
98
-
99
-
100
-
101
-
102
-
103
-
104
-
105
-
106
-
107
-
108
-
109
-
110
-
111
-
112
-
113
-
114
-
115
-
116
-
117
-
118
-
119
-
120
-
121
-
122
-
123
-
124
-
125
-
126
-
127
-
128
-
129
-
130
-
131
-
132
-
133
-
134
-
135
-
136
-
137
-
138
-
139
-
140
-
141
-
142
-
143
-
144
-
145
-
146
-
147
-
148
-
149
-
150
-
151
-
152
-
153
-
154
-
155
-
156
-
157
-
158
-
159
-
160
-
161
-
162
-
163
-
164
-
165
-
166
-
167
-
168
-
169
-
170
-
 171
171 -
 172
172 -
 173
173 -
 174
174 -
 175
175 -
 176
176 -
 177
177 -
 178
178 -
 179
179 -
 180
180 -
 181
181 -
 182
182 -
 183
183 -
 184
184 -
 185
185 -
 186
186 -
 187
187 -
 188
188 -
 189
189 -
 190
190 -
 191
191 -
192
-
193
-
194
-
195
-
196
-
197
-
198
-
199
-
200
-
201
-
202
-
203
-
204
-
205
-
206
-
207
-
208
-
209
-
210
-
211
-
212
-
213
-
214
-
215
-
216
-
217
-
218
-
219
-
220
 |
 |

179
ANNUAL REPORT FY2013/14
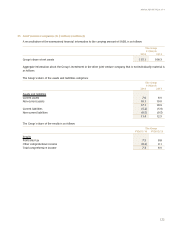
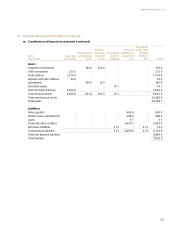
31 Investments (in $ million)
The Group The Company
31 March 31 March
2014 2013 2014 2013
Available-for-sale investments
Quoted
Government securities 3.1 2.5 - -
Equity investments 32.4 34.5 - -
Non-equity investments 186.2 279.5 167.6 256.5
221.7 316.5 167.6 256.5
Unquoted
Non-equity investments 30.3 20.0 30.3 20.0
252.0 336.5 197.9 276.5
Held-to-maturity investments
Quoted non-equity investments 35.4 12.9 35.4 12.9
287.4 349.4 233.3 289.4
The Group’s non-equity investments comprise investments in government securities, corporate bonds, credit-linked notes
and money market funds.
The interest rates for quoted government securities range from 1.63% to 4.00% (FY2012/13: 1.63% to 4.00%) per annum.
The interest rates for quoted non-equity investments range from 0.76% to 5.88% (FY2012/13: 0.05% to 5.88%) per annum,
while unquoted non-equity investments yield an interest rate of 2.28% to 2.30% (FY2012/13: 1.15%) per annum.
32 Cash and Bank Balances (in $ million)
The Group The Company
31 March 31 March
2014 2013 2014 2013
Fixed deposits 4,309.1 4,692.4 4,283.5 4,666.8
Cash and bank 574.8 367.2 340.3 167.5
4,883.9 5,059.6 4,623.8 4,834.3
As at 31 March 2014, the composition of cash and bank balances held in foreign currencies by the Group is as follows:
USD – 15.7% (2013: 6.8%), EUR – 2.1% (2013: 1.9%) and AUD – 1.7% (2013: 2.8%).
Cash at bank earns interest at floating rates based on daily bank deposit rates ranging from 0.06% to 3.51% (FY2012/13:
nil to 3.22%) per annum. Short-term deposits are made for varying periods of between one day and one year depending on
the immediate cash requirements of the Group, and earn interest at the respective short-term deposit rates. The weighted
average effective interest rate for short-term deposits is 0.65% (FY2012/13: 0.57%) per annum.