Singapore Airlines 2014 Annual Report Download - page 148
Download and view the complete annual report
Please find page 148 of the 2014 Singapore Airlines annual report below. You can navigate through the pages in the report by either clicking on the pages listed below, or by using the keyword search tool below to find specific information within the annual report.-
 1
1 -
2
-
3
-
4
-
5
-
6
-
7
-
8
-
9
-
10
-
11
-
12
-
13
-
14
-
15
-
16
-
17
-
18
-
19
-
20
-
21
-
22
-
23
-
24
-
25
-
26
-
27
-
28
-
29
-
30
-
31
-
32
-
33
-
34
-
35
-
36
-
37
-
38
-
39
-
40
-
41
-
42
-
43
-
44
-
45
-
46
-
47
-
48
-
49
-
50
-
51
-
52
-
53
-
54
-
55
-
56
-
57
-
58
-
59
-
60
-
61
-
62
-
63
-
64
-
65
-
66
-
67
-
68
-
69
-
70
-
71
-
72
-
73
-
74
-
75
-
76
-
77
-
78
-
79
-
80
-
81
-
82
-
83
-
84
-
85
-
86
-
87
-
88
-
89
-
90
-
91
-
92
-
93
-
94
-
95
-
96
-
97
-
98
-
99
-
100
-
101
-
102
-
103
-
104
-
105
-
106
-
107
-
108
-
109
-
110
-
111
-
112
-
113
-
114
-
115
-
116
-
117
-
118
-
119
-
120
-
121
-
122
-
123
-
124
-
125
-
126
-
127
-
128
-
129
-
130
-
131
-
132
-
133
-
134
-
135
-
136
-
137
-
 138
138 -
 139
139 -
 140
140 -
 141
141 -
 142
142 -
 143
143 -
 144
144 -
 145
145 -
 146
146 -
 147
147 -
 148
148 -
 149
149 -
 150
150 -
 151
151 -
 152
152 -
 153
153 -
 154
154 -
 155
155 -
 156
156 -
 157
157 -
 158
158 -
159
-
160
-
161
-
162
-
163
-
164
-
165
-
166
-
167
-
168
-
169
-
170
-
171
-
172
-
173
-
174
-
175
-
176
-
177
-
178
-
179
-
180
-
181
-
182
-
183
-
184
-
185
-
186
-
187
-
188
-
189
-
190
-
191
-
192
-
193
-
194
-
195
-
196
-
197
-
198
-
199
-
200
-
201
-
202
-
203
-
204
-
205
-
206
-
207
-
208
-
209
-
210
-
211
-
212
-
213
-
214
-
215
-
216
-
217
-
218
-
219
-
220
 |
 |

146
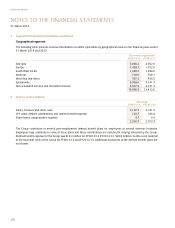
NOTES TO THE FINANCIAL STATEMENTS
31 March 2014
SINGAPORE AIRLINES
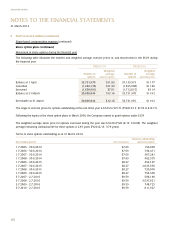
5 Staff Costs (in $ million) (continued)
Share-based compensation expense (continued)
Share-basedincentiveplans(continued)
Fair value of share awards granted
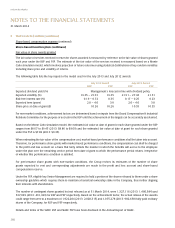
The fair value of services received in return for shares awarded is measured by reference to the fair value of shares granted
each year under the RSP and PSP. The estimate of the fair value of the services received is measured based on a Monte
Carlo simulation model, which involves projection of future outcomes using statistical distributions of key random variables
including share price and volatility of returns.
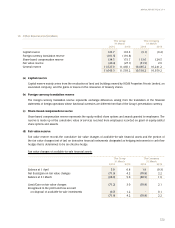
The following table lists the key inputs to the model used for the July 2013 and July 2012 awards:
July 2013 Award July 2012 Award
RSP PSP RSP PSP
Expected dividend yield (%) Management’s forecast in line with dividend policy
Expected volatility (%) 19.35 – 21.01 19.35 21.51 – 27.43 21.51
Risk-free interest rate (%) 0.19 – 0.72 0.35 0.17 – 0.25 0.23
Expected term (years) 2.0 – 4.0 3.0 2.0 – 4.0 3.0
Share price at date of grant ($) 10.26 10.26 10.55 10.55
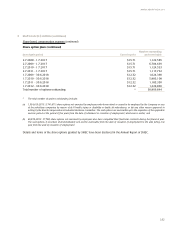
For non-market conditions, achievement factors are determined based on inputs from the Board Compensation & Industrial
Relations Committee for the purpose of accrual for the RSP until the achievement of the targets can be accurately ascertained.
Based on the Monte Carlo simulation model, the estimated fair value at date of grant for each share granted under the RSP
ranges from $8.67 to $9.45 (2013: $8.86 to $9.69) and the estimated fair value at date of grant for each share granted
under the PSP is $7.82 (2013: $9.35).
When estimating the fair value of the compensation cost, market-based performance conditions shall be taken into account.
Therefore, for performance share grants with market-based performance conditions, the compensation cost shall be charged
to the profit and loss account on a basis that fairly reflects the manner in which the benefits will accrue to the employee
under the plan over the remaining service period from date of grant to which the performance period relates, irrespective
of whether this performance condition is satisfied.
For performance share grants with non-market conditions, the Group revises its estimates of the number of share
grants expected to vest and corresponding adjustments are made to the profit and loss account and share-based
compensation reserve.
Under the PSP, eligible key Senior Management are required to hold a portion of the shares released to them under a share
ownership guideline which requires them to maintain a beneficial ownership stake in the Company, thus further aligning
their interests with shareholders.
The number of contingent shares granted but not released as at 31 March 2014, were 1,327,116 (2013: 1,460,384) and
537,639 (2013: 491,329) for RSP and PSP respectively. Based on the achievement factor, the actual release of the awards
could range from zero to a maximum of 1,922,204 (2013: 2,028,315) and 1,075,278 (2013: 982,658) fully-paid ordinary
shares of the Company, for RSP and PSP respectively.
Details and terms of the SIAEC RSP and SIAEC PSP have been disclosed in the Annual Report of SIAEC.