Singapore Airlines 2014 Annual Report Download - page 152
Download and view the complete annual report
Please find page 152 of the 2014 Singapore Airlines annual report below. You can navigate through the pages in the report by either clicking on the pages listed below, or by using the keyword search tool below to find specific information within the annual report.-
 1
1 -
2
-
3
-
4
-
5
-
6
-
7
-
8
-
9
-
10
-
11
-
12
-
13
-
14
-
15
-
16
-
17
-
18
-
19
-
20
-
21
-
22
-
23
-
24
-
25
-
26
-
27
-
28
-
29
-
30
-
31
-
32
-
33
-
34
-
35
-
36
-
37
-
38
-
39
-
40
-
41
-
42
-
43
-
44
-
45
-
46
-
47
-
48
-
49
-
50
-
51
-
52
-
53
-
54
-
55
-
56
-
57
-
58
-
59
-
60
-
61
-
62
-
63
-
64
-
65
-
66
-
67
-
68
-
69
-
70
-
71
-
72
-
73
-
74
-
75
-
76
-
77
-
78
-
79
-
80
-
81
-
82
-
83
-
84
-
85
-
86
-
87
-
88
-
89
-
90
-
91
-
92
-
93
-
94
-
95
-
96
-
97
-
98
-
99
-
100
-
101
-
102
-
103
-
104
-
105
-
106
-
107
-
108
-
109
-
110
-
111
-
112
-
113
-
114
-
115
-
116
-
117
-
118
-
119
-
120
-
121
-
122
-
123
-
124
-
125
-
126
-
127
-
128
-
129
-
130
-
131
-
132
-
133
-
134
-
135
-
136
-
137
-
138
-
139
-
140
-
141
-
 142
142 -
 143
143 -
 144
144 -
 145
145 -
 146
146 -
 147
147 -
 148
148 -
 149
149 -
 150
150 -
 151
151 -
 152
152 -
 153
153 -
 154
154 -
 155
155 -
 156
156 -
 157
157 -
 158
158 -
 159
159 -
 160
160 -
 161
161 -
 162
162 -
163
-
164
-
165
-
166
-
167
-
168
-
169
-
170
-
171
-
172
-
173
-
174
-
175
-
176
-
177
-
178
-
179
-
180
-
181
-
182
-
183
-
184
-
185
-
186
-
187
-
188
-
189
-
190
-
191
-
192
-
193
-
194
-
195
-
196
-
197
-
198
-
199
-
200
-
201
-
202
-
203
-
204
-
205
-
206
-
207
-
208
-
209
-
210
-
211
-
212
-
213
-
214
-
215
-
216
-
217
-
218
-
219
-
220
 |
 |

150
NOTES TO THE FINANCIAL STATEMENTS
31 March 2014
SINGAPORE AIRLINES
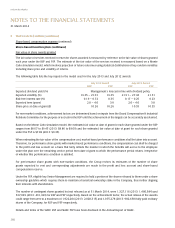
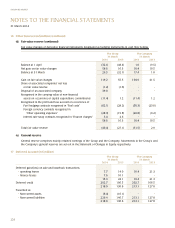
11 Taxation (in $ million) (continued)
Deferred taxation related to other comprehensive income:
The Group
FY2013/14 FY2012/13
Available-for-sale financial assets (0.9) 1.1
Cash flow hedges 4.3 1.5
Actuarial loss on revaluation of defined benefit plans (0.2) (0.9)
3.2 1.7
The Group has tax losses (of which no deferred tax asset has been recognised) of approximately $43.8 million (2013:
$56.0 million) that are available for offset against future taxable profits of the companies. This is due to the uncertainty of
the recoverability of the deferred tax asset. The use of the tax losses is subject to the agreement of the tax authorities and
compliance with certain provisions of the tax legislation of the respective countries in which the companies operate.
A reconciliation between taxation expense and the product of accounting profit multiplied by the applicable tax rate for the
years ended 31 March is as follows:
The Group
FY2013/14 FY2012/13
Profit before taxation 367.9 469.6
Less: Share of profits of associated and joint venture companies (48.8) (145.3)
319.1 324.3
Taxation at statutory corporate tax rate of 17.0% 54.2 55.1
Adjustments
Income not subject to tax (76.5) (29.4)
Expenses not deductible for tax purposes 35.5 26.0
Higher effective tax rates of other countries 8.4 9.7
Overprovision in respect of prior years, net (77.2) (32.0)
Income subject to concessionary tax rate (1.0) (1.0)
Tax benefit not recognised 1.0 0.7
Others (0.9) (1.1)
Taxation (56.5) 28.0
12 Earnings Per Share
The Group
FY2013/14 FY2012/13
Basic Diluted Basic Diluted
Profit attributable to owners of the Parent (in $ million) 359.5 359.5 378.9 378.9
Adjustment for dilutive potential ordinary shares
of subsidiary companies (in $ million) - (1.7) - (1.8)
Adjusted net profit attributable to owners of the Parent (in $ million) 359.5 357.8 378.9 377.1
Weighted average number of ordinary shares in issue (in million) 1,176.7 1,176.7 1,175.1 1,175.1
Adjustment for dilutive potential ordinary shares (in million) - 5.0 - 6.1
Weighted average number of ordinary shares in issue
used for computing earnings per share (in million) 1,176.7 1,181.7 1,175.1 1,181.2
Earnings per share (cents) 30.6 30.3 32.2 31.9