Singapore Airlines 2014 Annual Report Download - page 84
Download and view the complete annual report
Please find page 84 of the 2014 Singapore Airlines annual report below. You can navigate through the pages in the report by either clicking on the pages listed below, or by using the keyword search tool below to find specific information within the annual report.-
 1
1 -
2
-
3
-
4
-
5
-
6
-
7
-
8
-
9
-
10
-
11
-
12
-
13
-
14
-
15
-
16
-
17
-
18
-
19
-
20
-
21
-
22
-
23
-
24
-
25
-
26
-
27
-
28
-
29
-
30
-
31
-
32
-
33
-
34
-
35
-
36
-
37
-
38
-
39
-
40
-
41
-
42
-
43
-
44
-
45
-
46
-
47
-
48
-
49
-
50
-
51
-
52
-
53
-
54
-
55
-
56
-
57
-
58
-
59
-
60
-
61
-
62
-
63
-
64
-
65
-
66
-
67
-
68
-
69
-
70
-
71
-
72
-
73
-
 74
74 -
 75
75 -
 76
76 -
 77
77 -
 78
78 -
 79
79 -
 80
80 -
 81
81 -
 82
82 -
 83
83 -
 84
84 -
 85
85 -
 86
86 -
 87
87 -
 88
88 -
 89
89 -
 90
90 -
 91
91 -
 92
92 -
 93
93 -
 94
94 -
95
-
96
-
97
-
98
-
99
-
100
-
101
-
102
-
103
-
104
-
105
-
106
-
107
-
108
-
109
-
110
-
111
-
112
-
113
-
114
-
115
-
116
-
117
-
118
-
119
-
120
-
121
-
122
-
123
-
124
-
125
-
126
-
127
-
128
-
129
-
130
-
131
-
132
-
133
-
134
-
135
-
136
-
137
-
138
-
139
-
140
-
141
-
142
-
143
-
144
-
145
-
146
-
147
-
148
-
149
-
150
-
151
-
152
-
153
-
154
-
155
-
156
-
157
-
158
-
159
-
160
-
161
-
162
-
163
-
164
-
165
-
166
-
167
-
168
-
169
-
170
-
171
-
172
-
173
-
174
-
175
-
176
-
177
-
178
-
179
-
180
-
181
-
182
-
183
-
184
-
185
-
186
-
187
-
188
-
189
-
190
-
191
-
192
-
193
-
194
-
195
-
196
-
197
-
198
-
199
-
200
-
201
-
202
-
203
-
204
-
205
-
206
-
207
-
208
-
209
-
210
-
211
-
212
-
213
-
214
-
215
-
216
-
217
-
218
-
219
-
220
 |
 |

082
SINGAPORE AIRLINES
Performance of the Company (continued)
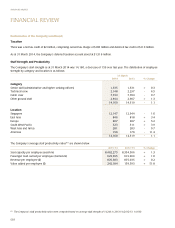
Expenditure
The Company’s expenditure increased 0.2 per cent to $12,224 million in 2013/14.
2013/14 2012/13
$million % $million % %Change
Fuel costs 4,772.6 39.1 4,951.4 40.6 - 3.6
Staff costs 1,567.0 12.8 1,609.7 13.2 - 2.7
Depreciation R7 1,311.7 10.7 1,295.9 10.6 + 1.2
Handling charges 870.6 7.1 860.9 7.1 + 1.1
Inflight meals and other passenger costs 671.8 5.5 658.0 5.4 + 2.1
Airport and overflying charges 599.4 4.9 576.6 4.7 + 4.0
Aircraft maintenance and overhaul costs 675.6 5.5 576.6 4.7 + 17.2
Rentals on leased aircraft 564.8 4.6 485.8 4.0 + 16.3
Sales costs R8 549.6 4.5 515.6 4.2 + 6.6
Communication and information technology costs R9 81.7 0.7 83.7 0.7 - 2.4
Other costs R10 559.3 4.6 585.6 4.8 - 4.5
Total 12,224.1 100.0 12,199.8 100.0 + 0.2
A breakdown of fuel cost is shown below:
2013/14 2012/13 Change
$ million $ million $ million
Fuel cost (before hedging) 4,843.7 4,979.1 - 135.4
Fuel hedging gain (71.1) (27.7) - 43.4
4,772.6 4,951.4 - 178.8
Expenditure of fuel before hedging was $135.4 million lower because of:
$ million
4.4% decrease in weighted average fuel price from 130.5 USD/BBL to 124.8 USD/BBL - 218.3
Strengthening of USD against SGD + 60.3
0.3% increase in volume uplifted from 30.9 million BBL to 31.0 million BBL + 22.6
- 135.4
Staff costs decreased $43 million (-2.7 per cent), mainly from lower staff strength and cadet training expenses.
Aircraft maintenance and overhaul costs increased 17.2% or $99 million largely due to higher provision for return conditions
for aircraft and T800 engines on lease, and more maintenance checks.
Rentals on leased aircraft increased $79 million (+16.3 per cent) mainly due to more aircraft on lease.
R7 Depreciation included impairment of property, plant and equipment and amortisation of computer software.
R8 Sales costs included commission and incentives, frequent flyer programme cost, computer reservation system booking fees, advertising expenses,
reservation system IT cost and other sales costs.
R9 Communication and information technology costs were for data transmission and contract service fees, hire of computer equipment, maintenance/
rental of software, and information technology contract and professional fees.
R10 Other costs mainly comprised crew expenses, company accommodation cost, foreign exchange revaluation and hedging loss, comprehensive aviation
insurance cost, airport lounge expenses, non-information technology contract and professional fees, expenses incurred to mount non-scheduled
services, aircraft licence fees and recoveries.
FINANCIAL REVIEW