Singapore Airlines 2014 Annual Report Download - page 74
Download and view the complete annual report
Please find page 74 of the 2014 Singapore Airlines annual report below. You can navigate through the pages in the report by either clicking on the pages listed below, or by using the keyword search tool below to find specific information within the annual report.-
 1
1 -
2
-
3
-
4
-
5
-
6
-
7
-
8
-
9
-
10
-
11
-
12
-
13
-
14
-
15
-
16
-
17
-
18
-
19
-
20
-
21
-
22
-
23
-
24
-
25
-
26
-
27
-
28
-
29
-
30
-
31
-
32
-
33
-
34
-
35
-
36
-
37
-
38
-
39
-
40
-
41
-
42
-
43
-
44
-
45
-
46
-
47
-
48
-
49
-
50
-
51
-
52
-
53
-
54
-
55
-
56
-
57
-
58
-
59
-
60
-
61
-
62
-
63
-
 64
64 -
 65
65 -
 66
66 -
 67
67 -
 68
68 -
 69
69 -
 70
70 -
 71
71 -
 72
72 -
 73
73 -
 74
74 -
 75
75 -
 76
76 -
 77
77 -
 78
78 -
 79
79 -
 80
80 -
 81
81 -
 82
82 -
 83
83 -
 84
84 -
85
-
86
-
87
-
88
-
89
-
90
-
91
-
92
-
93
-
94
-
95
-
96
-
97
-
98
-
99
-
100
-
101
-
102
-
103
-
104
-
105
-
106
-
107
-
108
-
109
-
110
-
111
-
112
-
113
-
114
-
115
-
116
-
117
-
118
-
119
-
120
-
121
-
122
-
123
-
124
-
125
-
126
-
127
-
128
-
129
-
130
-
131
-
132
-
133
-
134
-
135
-
136
-
137
-
138
-
139
-
140
-
141
-
142
-
143
-
144
-
145
-
146
-
147
-
148
-
149
-
150
-
151
-
152
-
153
-
154
-
155
-
156
-
157
-
158
-
159
-
160
-
161
-
162
-
163
-
164
-
165
-
166
-
167
-
168
-
169
-
170
-
171
-
172
-
173
-
174
-
175
-
176
-
177
-
178
-
179
-
180
-
181
-
182
-
183
-
184
-
185
-
186
-
187
-
188
-
189
-
190
-
191
-
192
-
193
-
194
-
195
-
196
-
197
-
198
-
199
-
200
-
201
-
202
-
203
-
204
-
205
-
206
-
207
-
208
-
209
-
210
-
211
-
212
-
213
-
214
-
215
-
216
-
217
-
218
-
219
-
220
 |
 |

072
SINGAPORE AIRLINES
Performance of the Group
Key Financial Highlights
2013/14 2012/13 % Change
Earnings For The Year ($ million)
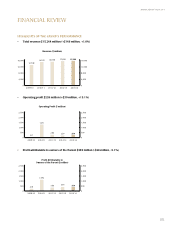
Revenue 15,243.9 15,098.2 + 1.0
Expenditure 14,984.6 14,869.0 + 0.8
Operating profit 259.3 229.2 + 13.1
Profit attributable to owners of the Parent 359.5 378.9 - 5.1
Per Share Data (cents)
Earnings per share – basic 30.6 32.2 - 5.0
Ordinary dividend per share 21.0 23.0 - 8.7
Special dividend per share 25.0 - n.m.
Ratios (%)
Return on equity holders’ funds 2.7 2.9 - 0.2 point
Return on total assets 1.9 2.0 - 0.1 point
n.m. not meaningful
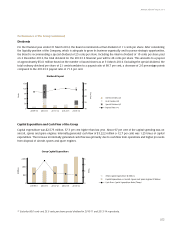
Group Earnings
During the financial year, operating conditions in the air transportation industry in Asia Pacific continued to be tough with intense
competition and overcapacity, thereby placing downward pressure on yields, as tactical promotions were carried out to bolster loads.
The depreciation of key revenue generating currencies, in particular AUD, JPY and INR against the SGD, compressed yields
further. Moreover, fuel prices remained elevated and range bound, limiting improvement on the Group’s bottom line as fuel
cost constituted the largest component, about 38 per cent, of the Group’s operating expenditure.
Group revenue grew $146 million (+1.0 per cent) to $15,244 million, mainly from airline operations, as a result of higher
incidental revenue and stronger passenger carriage, albeit at lower yields. This was partially offset by lower cargo revenue from
reduction in capacity, and weaker air freight demand and yields. The Group’s revenue by business segment is shown below:
2013/14 2012/13
$ million $ million
Airline operations 12,444.7 12,169.3
Cargo operations 2,248.3 2,415.3
Engineering services 508.5 470.9
Others 42.4 42.7
Total revenue 15,243.9 15,098.2
FINANCIAL REVIEW