Singapore Airlines 2014 Annual Report Download - page 78
Download and view the complete annual report
Please find page 78 of the 2014 Singapore Airlines annual report below. You can navigate through the pages in the report by either clicking on the pages listed below, or by using the keyword search tool below to find specific information within the annual report.-
 1
1 -
2
-
3
-
4
-
5
-
6
-
7
-
8
-
9
-
10
-
11
-
12
-
13
-
14
-
15
-
16
-
17
-
18
-
19
-
20
-
21
-
22
-
23
-
24
-
25
-
26
-
27
-
28
-
29
-
30
-
31
-
32
-
33
-
34
-
35
-
36
-
37
-
38
-
39
-
40
-
41
-
42
-
43
-
44
-
45
-
46
-
47
-
48
-
49
-
50
-
51
-
52
-
53
-
54
-
55
-
56
-
57
-
58
-
59
-
60
-
61
-
62
-
63
-
64
-
65
-
66
-
67
-
 68
68 -
 69
69 -
 70
70 -
 71
71 -
 72
72 -
 73
73 -
 74
74 -
 75
75 -
 76
76 -
 77
77 -
 78
78 -
 79
79 -
 80
80 -
 81
81 -
 82
82 -
 83
83 -
 84
84 -
 85
85 -
 86
86 -
 87
87 -
 88
88 -
89
-
90
-
91
-
92
-
93
-
94
-
95
-
96
-
97
-
98
-
99
-
100
-
101
-
102
-
103
-
104
-
105
-
106
-
107
-
108
-
109
-
110
-
111
-
112
-
113
-
114
-
115
-
116
-
117
-
118
-
119
-
120
-
121
-
122
-
123
-
124
-
125
-
126
-
127
-
128
-
129
-
130
-
131
-
132
-
133
-
134
-
135
-
136
-
137
-
138
-
139
-
140
-
141
-
142
-
143
-
144
-
145
-
146
-
147
-
148
-
149
-
150
-
151
-
152
-
153
-
154
-
155
-
156
-
157
-
158
-
159
-
160
-
161
-
162
-
163
-
164
-
165
-
166
-
167
-
168
-
169
-
170
-
171
-
172
-
173
-
174
-
175
-
176
-
177
-
178
-
179
-
180
-
181
-
182
-
183
-
184
-
185
-
186
-
187
-
188
-
189
-
190
-
191
-
192
-
193
-
194
-
195
-
196
-
197
-
198
-
199
-
200
-
201
-
202
-
203
-
204
-
205
-
206
-
207
-
208
-
209
-
210
-
211
-
212
-
213
-
214
-
215
-
216
-
217
-
218
-
219
-
220
 |
 |

076
SINGAPORE AIRLINES
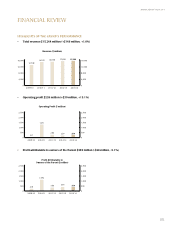
Performance of the Group (continued)
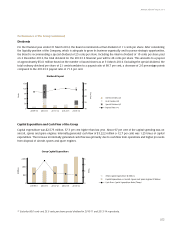
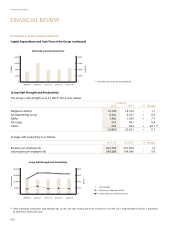
Capital Expenditure and Cash Flow of the Group (continued)
Internally Generated Cash Flow
Group Staff Strength and Productivity
Staff Number
40,000
30,000
20,000
10,000
0
$ ‘000
200
400
600
800
0
2013/14
$ Million
6,000
4,500
3,000
1,500
0
$ Million
1,500
3,000
4,500
6,000
0
2009/10 2010/11 2011/12 2012/13
Internally Generated Cash Flow ($ Million)
R3 Other subsidiary companies’ staff strength was up 40.1 per cent, mainly due to an increase in Scoot Pte. Ltd.’s staff strength by 268 as it expanded
its operations during the year.
Value Added per Employee ($’000)
Revenue per Employee ($’000)
Staff Strength
Group Staff Strength and Productivity
The Group’s staff strength as at 31 March 2014 is as follows:
31 March
2014 2013 % Change
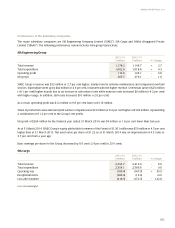
Singapore Airlines 14,160 14,319 - 1.1
SIA Engineering Group 6,432 6,377 + 0.9
SilkAir 1,462 1,360 + 7.5
SIA Cargo 914 981 - 6.8
Others 832 594 + 40.1
R3
23,800 23,631 + 0.7
Average staff productivity is as follows:
2013/14 2012/13 % Change
Revenue per employee ($) 642,769 651,093 - 1.3
Value added per employee ($) 184,268 194,040 - 5.0
FINANCIAL REVIEW
2013/142009/10 2010/11 2011/12 2012/13