Singapore Airlines 2014 Annual Report Download - page 189
Download and view the complete annual report
Please find page 189 of the 2014 Singapore Airlines annual report below. You can navigate through the pages in the report by either clicking on the pages listed below, or by using the keyword search tool below to find specific information within the annual report.-
 1
1 -
2
-
3
-
4
-
5
-
6
-
7
-
8
-
9
-
10
-
11
-
12
-
13
-
14
-
15
-
16
-
17
-
18
-
19
-
20
-
21
-
22
-
23
-
24
-
25
-
26
-
27
-
28
-
29
-
30
-
31
-
32
-
33
-
34
-
35
-
36
-
37
-
38
-
39
-
40
-
41
-
42
-
43
-
44
-
45
-
46
-
47
-
48
-
49
-
50
-
51
-
52
-
53
-
54
-
55
-
56
-
57
-
58
-
59
-
60
-
61
-
62
-
63
-
64
-
65
-
66
-
67
-
68
-
69
-
70
-
71
-
72
-
73
-
74
-
75
-
76
-
77
-
78
-
79
-
80
-
81
-
82
-
83
-
84
-
85
-
86
-
87
-
88
-
89
-
90
-
91
-
92
-
93
-
94
-
95
-
96
-
97
-
98
-
99
-
100
-
101
-
102
-
103
-
104
-
105
-
106
-
107
-
108
-
109
-
110
-
111
-
112
-
113
-
114
-
115
-
116
-
117
-
118
-
119
-
120
-
121
-
122
-
123
-
124
-
125
-
126
-
127
-
128
-
129
-
130
-
131
-
132
-
133
-
134
-
135
-
136
-
137
-
138
-
139
-
140
-
141
-
142
-
143
-
144
-
145
-
146
-
147
-
148
-
149
-
150
-
151
-
152
-
153
-
154
-
155
-
156
-
157
-
158
-
159
-
160
-
161
-
162
-
163
-
164
-
165
-
166
-
167
-
168
-
169
-
170
-
171
-
172
-
173
-
174
-
175
-
176
-
177
-
178
-
 179
179 -
 180
180 -
 181
181 -
 182
182 -
 183
183 -
 184
184 -
 185
185 -
 186
186 -
 187
187 -
 188
188 -
 189
189 -
 190
190 -
 191
191 -
 192
192 -
 193
193 -
 194
194 -
 195
195 -
 196
196 -
 197
197 -
 198
198 -
 199
199 -
200
-
201
-
202
-
203
-
204
-
205
-
206
-
207
-
208
-
209
-
210
-
211
-
212
-
213
-
214
-
215
-
216
-
217
-
218
-
219
-
220
 |
 |

187
ANNUAL REPORT FY2013/14
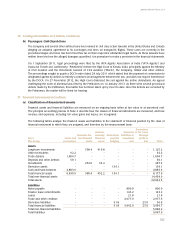
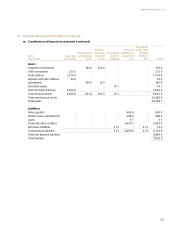
37 Financial Instruments (in $ million) (continued)
(a) Classification of financial instruments (continued)
Derivatives
Held-to- Financial atfairvalue
Available-for- maturity Derivatives liabilitiesat through
2013 Loans and sale financial financial used for amortised profit or
The Group receivables assets assets hedging cost loss Total
Assets
Long-term investments - 354.9 352.0 - - - 706.9
Other receivables 213.9 - - - - - 213.9
Trade debtors 1,578.4 - - - - - 1,578.4
Deposits and other debtors 54.9 - - - - - 54.9
Investments - 336.5 12.9 - - - 349.4
Derivative assets - - - 79.1 - - 79.1
Cash and bank balances 5,059.6 - - - - - 5,059.6
Total financial assets 6,906.8 691.4 364.9 79.1 - - 8,042.2
Total non-financial assets 14,385.9
Total assets 22,428.1
Liabilities
Notes payable - - - - 800.0 - 800.0
Finance lease commitments - - - - 208.4 - 208.4
Loans - - - - 5.7 - 5.7
Trade and other creditors - - - - 3,055.7 - 3,055.7
Derivative liabilities - - - 31.9 - 41.3 73.2
Total financial liabilities - - - 31.9 4,069.8 41.3 4,143.0
Total non-financial liabilities 4,883.0
Total liabilities 9,026.0