Entergy 2010 Annual Report Download - page 99
Download and view the complete annual report
Please find page 99 of the 2010 Entergy annual report below. You can navigate through the pages in the report by either clicking on the pages listed below, or by using the keyword search tool below to find specific information within the annual report.-
 1
1 -
2
-
3
-
4
-
5
-
6
-
7
-
8
-
9
-
10
-
11
-
12
-
13
-
14
-
15
-
16
-
17
-
18
-
19
-
20
-
21
-
22
-
23
-
24
-
25
-
26
-
27
-
28
-
29
-
30
-
31
-
32
-
33
-
34
-
35
-
36
-
37
-
38
-
39
-
40
-
41
-
42
-
43
-
44
-
45
-
46
-
47
-
48
-
49
-
50
-
51
-
52
-
53
-
54
-
55
-
56
-
57
-
58
-
59
-
60
-
61
-
62
-
63
-
64
-
65
-
66
-
67
-
68
-
69
-
70
-
71
-
72
-
73
-
74
-
75
-
76
-
77
-
78
-
79
-
80
-
81
-
82
-
83
-
84
-
85
-
86
-
87
-
88
-
 89
89 -
 90
90 -
 91
91 -
 92
92 -
 93
93 -
 94
94 -
 95
95 -
 96
96 -
 97
97 -
 98
98 -
 99
99 -
 100
100 -
 101
101 -
 102
102 -
 103
103 -
 104
104 -
 105
105 -
 106
106 -
 107
107 -
 108
108 -
 109
109 -
110
-
111
-
112
-
113
-
114
-
115
-
116
 |
 |

ENTERGY CORPORATION AND SUBSIDIARIES 2010
Notes to Consolidated Financial Statements continued
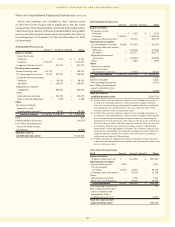
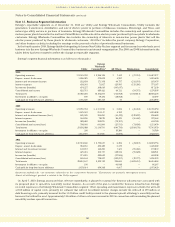
Assets and liabilities are classified in their entirety based
on the lowest level of input that is significant to the fair value
measurement. The following tables set forth by level within the fair
value hierarchy a summary of the investments held for the qualified
pension and other postretirement plans measured at fair value on
a recurring basis at December 31, 2010 and December 31, 2009
(in thousands):
2010 Qualified Pension Trust
Level 1 Level 2 Level 3 Total
Equity securities:
Corporate stocks:
Preferred $ – $ 8,354 $– $ 8,354
Common 1,375,531 – – 1,375,531
Common collective trusts(a) – 657,075 – 657,075
Fixed income securities:
Interest-bearing cash 103,731 – – 103,731
U.S. government securities 75,124 187,957 – 263,081
Corporate debt instruments:
Preferred – 88,709 – 88,709
All others – 210,051 – 210,051
Registered investment
companies(c) – 385,020 – 385,020
Other:
International securities – 101,257 – 101,257
State and local obligations – 7,048 – 7,048
Other:
Insurance company
general account
(unallocated contracts) – 33,439 – 33,439
Total investments $1,554,386 $1,678,910 $– $3,233,296
Cash 321
Other pending transactions (14,954)
Less: Other postretirement
assests included in total
investments (2,395)
Total fair value of
qualified pension assets $3,216,268
2009 Qualified Pension Trust
Level 1 Level 2 Level 3 Total
Equity securities:
Corporate stocks:
Preferred $ – $ 5,318 $– $ 5,318
Common 1,336,454 – – 1,336,454
Common collective trusts(b) – 431,703 – 431,703
Fixed income securities:
U.S. government securities 60,048 100,025 – 160,073
Corporate debt instruments:
Preferred – 164,448 – 164,448
All others – 202,377 – 202,377
Registered investment
companies(c) – 264,643 – 264,643
Other – 6,084 – 6,084
Other:
Insurance company
general account
(unallocated contracts) – 32,422 – 32,422
Total investments $1,396,502 $1,207,020 $– $2,603,522
Cash 1,382
Interest receivable 6,422
Other pending transactions (1,716)
Less: Other postretirement
assests included in total
investments (2,336)
Total fair value of
qualified pension assets $2,607,274
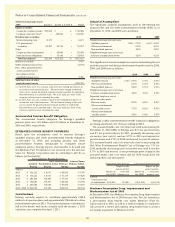
(a) In 2010, there were two common collective trusts holding investments in
accordance with stated objectives. The investment strategy of the both
trusts was to capture the growth potential of equity markets by replicating
the performance of a specified index. Net asset value per share of the
common collective trusts estimated fair value.
(b) In 2009, there were two common collective trusts holding investments in
accordance with stated objectives. The investment strategy of the first trust
was to capture the growth potential of equity markets by replicating the
performance of a specified index. Fair value for this trust was estimated at
net asset value per share. The other common collective trust was invested
in short-term fixed income securities and other securities with debt-like
characteristics and a high degree of liquidity. This common collective trust
fund used the amortization cost method of valuation pursuant to Rule 2a7
of the Investment Company Act of 1940, which allowed it to maintain a
stable net asset value of $1.00 per share.
(c) In 2009 and 2010, the registered investment companies held investments
in domestic and international bond markets and estimated fair value using
net asset value per share.
Other Postretirement Trusts
2010 Level 1 Level 2 Level 3 Total
Equity securities:
Common collective trust(a) $ – $211,835 $– $211,835
Fixed income securities:
Interest-bearing cash 4,014 – – 4,014
U.S. government
securities 37,823 52,326 – 90,149
Corporate debt instruments – 37,128 – 37,128
Other:
International securities – 1,756 – 1,756
State and local obligations – 56,960 – 56,960
Total investments $41,837 $360,005 $– $401,842
Other pending transactions 193
Plus: Other postretirement
assets included in the
investments of the
qualified pension trust 2,395
Total fair value of other
postretirement assets $404,430
97