Entergy 2010 Annual Report Download - page 97
Download and view the complete annual report
Please find page 97 of the 2010 Entergy annual report below. You can navigate through the pages in the report by either clicking on the pages listed below, or by using the keyword search tool below to find specific information within the annual report.-
 1
1 -
2
-
3
-
4
-
5
-
6
-
7
-
8
-
9
-
10
-
11
-
12
-
13
-
14
-
15
-
16
-
17
-
18
-
19
-
20
-
21
-
22
-
23
-
24
-
25
-
26
-
27
-
28
-
29
-
30
-
31
-
32
-
33
-
34
-
35
-
36
-
37
-
38
-
39
-
40
-
41
-
42
-
43
-
44
-
45
-
46
-
47
-
48
-
49
-
50
-
51
-
52
-
53
-
54
-
55
-
56
-
57
-
58
-
59
-
60
-
61
-
62
-
63
-
64
-
65
-
66
-
67
-
68
-
69
-
70
-
71
-
72
-
73
-
74
-
75
-
76
-
77
-
78
-
79
-
80
-
81
-
82
-
83
-
84
-
85
-
86
-
 87
87 -
 88
88 -
 89
89 -
 90
90 -
 91
91 -
 92
92 -
 93
93 -
 94
94 -
 95
95 -
 96
96 -
 97
97 -
 98
98 -
 99
99 -
 100
100 -
 101
101 -
 102
102 -
 103
103 -
 104
104 -
 105
105 -
 106
106 -
 107
107 -
108
-
109
-
110
-
111
-
112
-
113
-
114
-
115
-
116
 |
 |

ENTERGY CORPORATION AND SUBSIDIARIES 2010
Notes to Consolidated Financial Statements continued
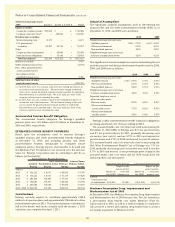
Other Postretirement Benefit Obligations,
Plan Assets, Funded Status, and Amounts Not Yet
Recognized and Recognized in the Balance Sheet
of Entergy Corporation and its Subsidiaries as of
December 31, 2010 and 2009 (in thousands):
2010 2009
Change in APBO
Balance at beginning of year $1,280,076 $1,155,072
Service cost 52,313 46,765
Interest cost 76,078 75,265
Plan amendments (50,548) –
Plan participant contributions 14,275 17,394
Actuarial (gain)/loss 92,340 59,537
Benefits paid (83,613) (79,076)
Medicare Part D subsidy received 5,449 5,119
Balance at end of year $1,386,370 $1,280,076
Change in Plan Assets
Fair value of assets at beginning of year $ 362,399 $ 295,908
Actual return on plan assets 36,364 58,038
Employer contributions 75,005 70,135
Plan participant contributions 14,275 17,394
Benefits paid (83,613) (79,076)
Fair value of assets at end of year $ 404,430 $ 362,399
Funded status $ (981,940) $ (917,677)
Amounts recognized in the balance sheet
Current liabilities $ (30,225) $ (31,189)
Non-current liabilities (951,715) (886,488)
Total funded status $ (981,940) $ (917,677)
Amounts recognized as a regulatory asset
(before tax)
Transition obligation $ 5,118 $ 9,325
Prior service cost/(credit) (8,442) 1,877
Net loss 253,415 239,400
$ 250,091 $ 250,602
Amounts recognized as AOCI (before tax)
Transition obligation $ 1,242 $ 1,862
Prior service credit (48,925) (21,855)
Net loss 198,466 147,563
$ 150,783 $ 127,570
Accounting for Pension and Other
Postretirement Benefits
Accounting standards require an employer to recognize in
its balance sheet the funded status of its benefit plans. This is
measured as the difference between plan assets at fair value and
the benefit obligation. Entergy uses a December 31 measurement
date for its pension and other postretirement plans. Employers are
to record previously unrecognized gains and losses, prior service
costs, and any remaining transition asset or obligation (that
resulted from adopting prior pension and other postretirement
benefits accounting standards) as comprehensive income and/
or as a regulatory asset reflective of the recovery mechanism for
pension and other postretirement benefit costs in the Utility’s
jurisdictions. For the portion of Entergy Gulf States Louisiana
that is not regulated, the unrecognized prior service cost, gains
and losses, and transition asset/obligation for its pension and
other postretirement benefit obligations are recorded as other
comprehensive income. Entergy Gulf States Louisiana and
Entergy Louisiana recover other postretirement benefit costs
on a pay as you go basis and record the unrecognized prior
service cost, gains and losses, and transition obligation for its
other postretirement benefit obligation as other comprehensive
income. Accounting standards also requires that changes in the
funded status be recorded as other comprehensive income and/
or a regulatory asset in the period in which the changes occur.
With regard to pension and other postretirement costs,
Entergy calculates the expected return on pension and other
postretirement benefit plan assets by multiplying the long term
expected rate of return on assets by the market-related value
(MRV) of plan assets. Entergy determines the MRV of pension
plan assets by calculating a value that uses a 20-quarter phase-in
of the difference between actual and expected returns. For other
postretirement benefit plan assets Entergy uses fair value when
determining MRV.
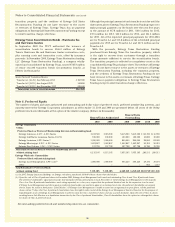
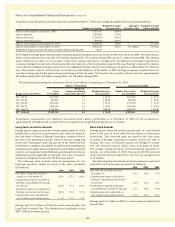
Qualified Pension and Other Postretirement
Plans’ Assets
Entergy’s qualified pension and postretirement plans’ weighted-
average asset allocations by asset category at December 31, 2010
and 2009 are as follows:
Qualified Pension
Actual Asset Allocation 2010 2009
Domestic Equity Securities 44% 46%
International Equity Securities 20% 21%
Fixed-Income Securities 35% 32%
Other 1% 1%
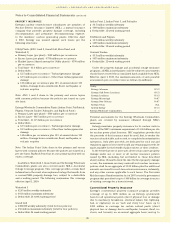
Postretirement
Actual Asset Allocation 2010 2009
Non- Non-
Taxable Taxable Taxable Taxable
Domestic Equity Securities 39% 39% 40% 36%
International Equity Securities 18% –% 19% –%
Fixed-Income Securities 43% 60% 41% 63%
Other –% 1% –% 1%
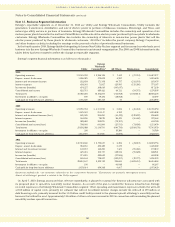
The Plan Administrator’s trust asset investment strategy is
to invest the assets in a manner whereby long term earnings on
the assets (plus cash contributions) provide adequate funding
for retiree benefit payments. The mix of assets is based on an
optimization study that identifies asset allocation targets in order
to achieve the maximum return for an acceptable level of risk,
while minimizing the expected contributions and pension and
postretirement expense.
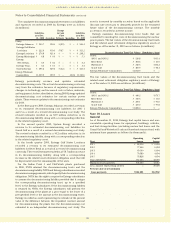
In the optimization study, the Plan Administrator formulates
assumptions about characteristics, such as expected asset class
investment returns, volatility (risk), and correlation coefficients
95