Entergy 2010 Annual Report Download - page 33
Download and view the complete annual report
Please find page 33 of the 2010 Entergy annual report below. You can navigate through the pages in the report by either clicking on the pages listed below, or by using the keyword search tool below to find specific information within the annual report.-
 1
1 -
2
-
3
-
4
-
5
-
6
-
7
-
8
-
9
-
10
-
11
-
12
-
13
-
14
-
15
-
16
-
17
-
18
-
19
-
20
-
21
-
22
-
 23
23 -
 24
24 -
 25
25 -
 26
26 -
 27
27 -
 28
28 -
 29
29 -
 30
30 -
 31
31 -
 32
32 -
 33
33 -
 34
34 -
 35
35 -
 36
36 -
 37
37 -
 38
38 -
 39
39 -
 40
40 -
 41
41 -
 42
42 -
 43
43 -
44
-
45
-
46
-
47
-
48
-
49
-
50
-
51
-
52
-
53
-
54
-
55
-
56
-
57
-
58
-
59
-
60
-
61
-
62
-
63
-
64
-
65
-
66
-
67
-
68
-
69
-
70
-
71
-
72
-
73
-
74
-
75
-
76
-
77
-
78
-
79
-
80
-
81
-
82
-
83
-
84
-
85
-
86
-
87
-
88
-
89
-
90
-
91
-
92
-
93
-
94
-
95
-
96
-
97
-
98
-
99
-
100
-
101
-
102
-
103
-
104
-
105
-
106
-
107
-
108
-
109
-
110
-
111
-
112
-
113
-
114
-
115
-
116
 |
 |

ENTERGY CORPORATION AND SUBSIDIARIES 2010
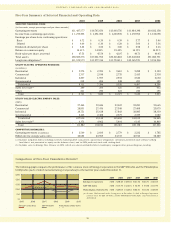
Five-Year Summary of Selected Financial and Operating Data
2010 2009 2008 2007 2006
SELECTED FINANCIAL DATA:
(in thousands, except percentages and per share amounts)
Operating revenues $11,487,577 $10,745,650 $13,093,756 $ 11,484,398 $10,932,158
Income from continuing operations $ 1,270,305 $ 1,251,050 $ 1,240,535 $ 1,159,954 $ 1,133,098
Earnings per share from continuing operations:
Basic $ 6.72 $ 6.39 $ 6.39 $ 5.77 $ 5.46
Diluted $ 6.66 $ 6.30 $ 6.20 $ 5.60 $ 5.36
Dividends declared per share $ 3.24 $ 3.00 $ 3.00 $ 2.58 $ 2.16
Return on common equity 14.61% 14.85% 15.42% 14.13% 14.21%
Book value per share, year-end $ 47.53 $ 45.54 $ 42.07 $ 40.71 $ 40.45
Total assets $38,685,276 $ 37,561,953 $ 36,616,818 $ 33,643,002 $ 31,082,731
Long-term obligations(a) $11,575,973 $11,277,314 $11,734,411 $10,165,735 $ 9,194,206
UTILITY ELECTRIC OPERATING REVENUES:
(in millions)
Residential $ 3,375 $ 2,999 $ 3,610 $ 3,228 $ 3,193
Commercial 2,317 2,184 2,735 2,413 2,318
Industrial 2,207 1,997 2,933 2,545 2,630
Governmental 212 204 248 221 155
Total retail 8,111 7,384 9,526 8,407 8,296
Sales for resale(b) 389 206 325 393 612
Other 241 290 222 246 155
Total $ 8,741 $ 7,880 $ 10,073 $ 9,046 $ 9,063
UTILITY BILLED ELECTRIC ENERGY SALES:
(GWh)
Residential 37,465 33,626 33,047 33,281 31,665
Commercial 28,831 27,476 27,340 27,408 25,079
Industrial 38,751 35,638 37,843 38,985 38,339
Governmental 2,463 2,408 2,379 2,339 1,580
Total retail 107,510 99,148 100,609 102,013 96,663
Sales for resale(b) 4,372 4,862 5,401 6,145 10,803
Total 111,882 104,010 106,010 108,158 107,466
COMPETITIVE BUSINESSES:
Operating revenues (in millions) $ 2,549 $ 2,693 $ 2,779 $ 2,232 $ 1,785
Billed electric energy sales (GWh) 42,682 43,969 44,747 40,916 38,289
(a) Includes long-term debt (excluding currently maturing debt), noncurrent capital lease obligations, subsidiary preferred stock without sinking
fund that is not presented as equity on the balance sheet, and in 2006 preferred stock with sinking fund.
(b) Includes sales to Entergy New Orleans in 2006, which was deconsolidated while its bankruptcy reorganization proceeding was pending.
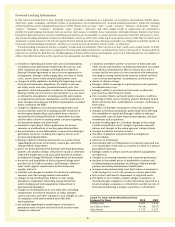
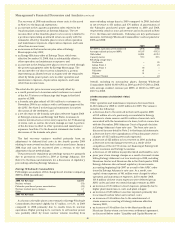
Comparison of Five-Year Cumulative Return(a)
The following graph compares the performance of the common stock of Entergy Corporation to the S&P 500 Index and the Philadelphia
Utility Index (each of which includes Entergy Corporation) for the last five years ended December 31.
2005 2006 2007 2008 2009 2010
Entergy Corporation $100 $138.40 $183.44 $131.52 $134.71 $121.60
S&P 500 Index $100 $115.79 $122.16 $ 76.96 $ 73.90 $111.99
Philadelphia Utility Index $100 $120.03 $142.81 $103.91 $114.35 $120.86
(a) Assumes $100 invested at the closing price on December 31, 2005 in Entergy Corporation
common stock, the S&P 500 Index, and the Philadelphia Utility Index, and reinvestment of
all dividends.
$250
$200
$150
$100
$50
$0
2005 2006 2007 2008 2009 2010
Entergy Corporation S&P 500 Index Philadelphia Utility Index
31