Entergy 2010 Annual Report Download - page 60
Download and view the complete annual report
Please find page 60 of the 2010 Entergy annual report below. You can navigate through the pages in the report by either clicking on the pages listed below, or by using the keyword search tool below to find specific information within the annual report.-
 1
1 -
2
-
3
-
4
-
5
-
6
-
7
-
8
-
9
-
10
-
11
-
12
-
13
-
14
-
15
-
16
-
17
-
18
-
19
-
20
-
21
-
22
-
23
-
24
-
25
-
26
-
27
-
28
-
29
-
30
-
31
-
32
-
33
-
34
-
35
-
36
-
37
-
38
-
39
-
40
-
41
-
42
-
43
-
44
-
45
-
46
-
47
-
48
-
49
-
 50
50 -
 51
51 -
 52
52 -
 53
53 -
 54
54 -
 55
55 -
 56
56 -
 57
57 -
 58
58 -
 59
59 -
 60
60 -
 61
61 -
 62
62 -
 63
63 -
 64
64 -
 65
65 -
 66
66 -
 67
67 -
 68
68 -
 69
69 -
 70
70 -
71
-
72
-
73
-
74
-
75
-
76
-
77
-
78
-
79
-
80
-
81
-
82
-
83
-
84
-
85
-
86
-
87
-
88
-
89
-
90
-
91
-
92
-
93
-
94
-
95
-
96
-
97
-
98
-
99
-
100
-
101
-
102
-
103
-
104
-
105
-
106
-
107
-
108
-
109
-
110
-
111
-
112
-
113
-
114
-
115
-
116
 |
 |

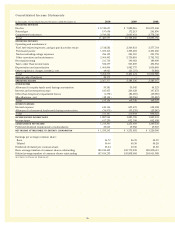
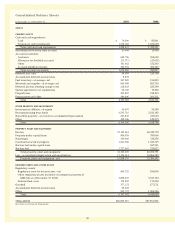
Consolidated Balance Sheets
In thousands, as of December 31, 2010 2009
ASSETS
CURRENT ASSETS
Cash and cash equivalents:
Cash $ 76,290 $ 85,861
Temporary cash investments 1,218,182 1,623,690
Total cash and cash equivalents 1,294,472 1,709,551
Securitization recovery trust account 43,044 13,098
Accounts receivable:
Customer 602,796 553,692
Allowance for doubtful accounts (31,777) (27,631)
Other 161,662 152,303
Accrued unbilled revenues 302,901 302,463
Total accounts receivable 1,035,582 980,827
Deferred fuel costs 64,659 126,798
Accumulated deferred income taxes 8,472 –
Fuel inventory - at average cost 207,520 196,855
Materials and supplies - at average cost 866,908 825,702
Deferred nuclear refueling outage costs 218,423 225,290
System agreement cost equalization 52,160 70,000
Prepaid taxes 301,807 184,819
Prepayments and other 246,036 201,221
Total 4,339,083 4,534,161
OTHER PROPERTY AND INVESTMENTS
Investment in affiliates - at equity 40,697 39,580
Decommissioning trust funds 3,595,716 3,211,183
Non-utility property - at cost (less accumulated depreciation) 257,847 247,664
Other 405,946 120,273
Total 4,300,206 3,618,700
PROPERTY, PLANT AND EQUIPMENT
Electric 37,153,061 36,343,772
Property under capital lease 800,078 783,096
Natural gas 330,608 314,256
Construction work in progress 1,661,560 1,547,319
Nuclear fuel under capital lease – 527,521
Nuclear fuel 1,377,962 739,827
Total property, plant and equipment 41,323,269 40,255,791
Less - accumulated depreciation and amortization 17,474,914 16,866,389
Property, plant and equipment - net 23,848,355 23,389,402
DEFERRED DEBITS AND OTHER ASSETS
Regulatory assets:
Regulatory asset for income taxes - net 845,725 816,856
Other regulatory assets (includes securitization property of
$882,346 as of December 31, 2010) 3,838,237 3,647,154
Deferred fuel costs 172,202 172,202
Goodwill 377,172 377,172
Accumulated deferred income taxes 54,523 –
Other 909,773 1,006,306
Total 6,197,632 6,019,690
TOTAL ASSETS $38,685,276 $37,561,953
See Notes to Financial Statements.
58