Entergy 2010 Annual Report Download - page 82
Download and view the complete annual report
Please find page 82 of the 2010 Entergy annual report below. You can navigate through the pages in the report by either clicking on the pages listed below, or by using the keyword search tool below to find specific information within the annual report.-
 1
1 -
2
-
3
-
4
-
5
-
6
-
7
-
8
-
9
-
10
-
11
-
12
-
13
-
14
-
15
-
16
-
17
-
18
-
19
-
20
-
21
-
22
-
23
-
24
-
25
-
26
-
27
-
28
-
29
-
30
-
31
-
32
-
33
-
34
-
35
-
36
-
37
-
38
-
39
-
40
-
41
-
42
-
43
-
44
-
45
-
46
-
47
-
48
-
49
-
50
-
51
-
52
-
53
-
54
-
55
-
56
-
57
-
58
-
59
-
60
-
61
-
62
-
63
-
64
-
65
-
66
-
67
-
68
-
69
-
70
-
71
-
 72
72 -
 73
73 -
 74
74 -
 75
75 -
 76
76 -
 77
77 -
 78
78 -
 79
79 -
 80
80 -
 81
81 -
 82
82 -
 83
83 -
 84
84 -
 85
85 -
 86
86 -
 87
87 -
 88
88 -
 89
89 -
 90
90 -
 91
91 -
 92
92 -
93
-
94
-
95
-
96
-
97
-
98
-
99
-
100
-
101
-
102
-
103
-
104
-
105
-
106
-
107
-
108
-
109
-
110
-
111
-
112
-
113
-
114
-
115
-
116
 |
 |

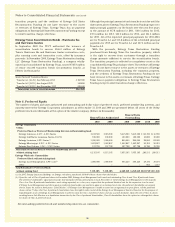
Notes to Consolidated Financial Statements continued
Note 3. Income Taxes
Income tax expenses from continuing operations for 2010, 2009,
and 2008 for Entergy Corporation and Subsidiaries consist of
the following (in thousands):
2010 2009 2008
Current:
Federal $ 145,161 $ (433,105) $ 451,517
Foreign 131 154 256
State 19,313 (108,552) 146,171
Total 164,605 (541,503) 597,944
Deferred and non-current - net 468,698 1,191,418 23,022
Investment tax credit
adjustments - net (16,064) (17,175) (17,968)
Income tax expense from
continuing operations $617,239 $ 632,740 $602,998
Total income taxes for Entergy Corporation and subsidiaries
differ from the amounts computed by applying the statutory income
tax rate to income before taxes. The reasons for the differences for
the years 2010, 2009, and 2008 are (in thousands):
2010 2009 2008
Net income attributable to
Entergy Corporation $1,250,242 $1,231,092 $1,220,566
Preferred dividend
requirements of subsidiaries 20,063 19,958 19,969
Consolidated net income 1,270,305 1,251,050 1,240,535
Income taxes 617,239 632,740 602,998
Income before income taxes $1,887,544 $1,883,790 $1,843,533
Computed at statutory
rate (35%) $ 660,640 $ 659,327 $ 645,237
Increases (reductions) in tax
resulting from:
State income taxes net of
federal income tax effect 40,530 65,241 9,926|
Regulatory differences -
utility plant items 14,931 57,383 45,543
Amortization of investment
tax credits (15,980) (16,745) (17,458)
Writeoff of
reorganization costs (19,974) – –
Tax law change-Medicare
Part D 13,616 – –
Decommissioning
trust fund basis – (7,917) (417)
Capital gains (losses) – (28,051) (74,278)
Flow-through/permanent
differences (26,370) (49,486) 14,656
Provision for uncertain
tax positions (43,115) (17,435) (27,970)
Valuation allowance – (40,795) 11,770
Other - net (7,039) 11,218 (4,011)
Total income
taxes as reported $ 617,239 $ 632,740 $ 602,998
Effective income tax rate 32.7% 33.6% 32.7%
Significant components of accumulated deferred income taxes
and taxes accrued for Entergy Corporation and Subsidiaries as of
December 31, 2010 and 2009 are as follows (in thousands):
2010 2009
Deferred tax liabilities:
Plant-related basis differences $ (5,947,760) $ (5,520,095)
Net regulatory assets (liabilities) (1,074,133) (1,147,710)
Power purchase agreements (265,429) (862,322)
Nuclear decommissioning trusts (439,481) (855,608)
Other (679,302 (456,053)
Total (8,406,105) (8,841,788)
Deferred tax assets:
Accumulated deferred investment
tax credit 111,170 118,587
Pension and other post-employment benefits 161,730 356,284
Nuclear decommissioning liabilities 285,889 313,648
Sale and leaseback 256,157 260,934
Provision for regulatory adjustments 100,504 103,403
Provision for contingencies 28,554 98,514
Unbilled/deferred revenues 18,642 31,995
Customer deposits 15,724 13,073
Net operating loss carryforwards 123,710 148,979
Capital losses 56,602 45,787
Other 19,009 160,264
Valuation allowance (70,089) (47,998)
Total 1,107,602 1,603,470
Noncurrent accrued taxes (including
unrecognized tax benefits) $ (1,261,455) $ (473,064)
Accumulated deferred income
taxes accrued $(8,559,958) $(7,711,382)
Entergy’s estimated tax attribute carryovers and their expira-
tion dates as of December 31, 2010 are as follows:
Carryover Description Carryover Amount Year(s) of expiration
Federal net operating losses $ 10 billion 2023 - 2029
State net operating losses $ 7.5 billion 2011 - 2030
Federal capital losses $ 60.7 million 2014
State capital losses $ 855 million 2011 - 2015
Federal minimum
tax credits $ 29 million never
Other federal and
state credits $ 70 million 2011 - 2030
As a result of the accounting for uncertain tax positions,
the amount of the deferred tax assets reflected in the financial
statements is less than the amount of the tax effect of the federal
and state net operating loss carryovers, tax credit carryovers,
and other tax attributes reflected on income tax returns.
Because it is more likely than not that the benefit from certain
state net operating and capital loss carryovers will not be
utilized, a valuation allowance of $28 million and $34 million has
been provided on the deferred tax assets relating to these state
net operating and capital loss carryovers, respectively.
80