Entergy 2010 Annual Report Download - page 3
Download and view the complete annual report
Please find page 3 of the 2010 Entergy annual report below. You can navigate through the pages in the report by either clicking on the pages listed below, or by using the keyword search tool below to find specific information within the annual report.-
 1
1 -
 2
2 -
 3
3 -
 4
4 -
 5
5 -
 6
6 -
 7
7 -
 8
8 -
 9
9 -
 10
10 -
 11
11 -
 12
12 -
 13
13 -
 14
14 -
15
-
16
-
17
-
18
-
19
-
20
-
21
-
22
-
23
-
24
-
25
-
26
-
27
-
28
-
29
-
30
-
31
-
32
-
33
-
34
-
35
-
36
-
37
-
38
-
39
-
40
-
41
-
42
-
43
-
44
-
45
-
46
-
47
-
48
-
49
-
50
-
51
-
52
-
53
-
54
-
55
-
56
-
57
-
58
-
59
-
60
-
61
-
62
-
63
-
64
-
65
-
66
-
67
-
68
-
69
-
70
-
71
-
72
-
73
-
74
-
75
-
76
-
77
-
78
-
79
-
80
-
81
-
82
-
83
-
84
-
85
-
86
-
87
-
88
-
89
-
90
-
91
-
92
-
93
-
94
-
95
-
96
-
97
-
98
-
99
-
100
-
101
-
102
-
103
-
104
-
105
-
106
-
107
-
108
-
109
-
110
-
111
-
112
-
113
-
114
-
115
-
116
 |
 |

Entergy Corporation and Subsidiaries 2010 Contents
Maximizing Value for Our Stakeholders
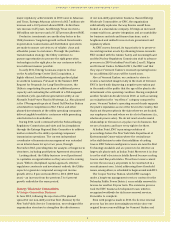
ver the past 12 years we have worked diligently to maximize the value we deliver to our
customers, employees and shareholders. Along the way we have learned many memorable
lessons and uncovered practical truths. We apply the knowledge we have gained to our
ongoing operations, improving and enhancing our capabilities as we go forward. In this year’s annual
report, we relate our story to classic fables – interesting stories with a moral – on some of the most
important memorable lessons and practical truths we have learned. The morals presented here refl ect
some of the essential principles that we adhere to as we work to build Entergy’s future success.
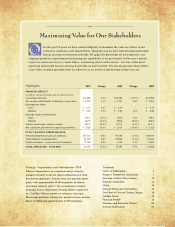
Highlights
Highlights
Highlights
2010
Change
2009
Change
2008
FINANCIAL RESULTS
(in millions, except percentages and per share amounts)
Operating revenues $11,488 6.9% $10,746 (17.9%) $13,094
$11,488
Net income attributable to Entergy Corporation $ 1,250 1.5% $ 1,231 0.8% $ 1,221
$ 1,250
Earnings per share
Basic $ 6.72 5.2% $ 6.39 – $ 6.39
$ 6.72
Diluted $ 6.66 5.7% $ 6.30 1.6% $ 6.20
$ 6.66
Average shares outstanding
Basic 186.0 (3.5%) 192.8 1.0% 190.9
186.0
Diluted 187.8 (4.1%) 195.8 (2.6%) 201.0
187.8
Return on average common equity 14.6% (2.0%) 14.9% (3.3%) 15.4%
14.6%
Net cash fl ow provided by operating activities $ 3,926 33.9% $ 2,933 (11.8%) $ 3,324
$ 3,926
UTILITY ELECTRIC OPERATING DATA
Retail kilowatt-hour sales (in millions) 107,510 8.4% 99,148 (1.5%) 100,609
107,510
Peak demand (in megawatts) 21,799 3.8% 21,009 (1.1%) 21,241
21,799
Retail customers – year-end (in thousands) 2,743 0.9% 2,719 1.1% 2,689
2,743
TOTAL EMPLOYEES – YEAR-END
14,958 (1.5%) 15,181 3.5% 14,669
14,958