Entergy 2010 Annual Report Download - page 37
Download and view the complete annual report
Please find page 37 of the 2010 Entergy annual report below. You can navigate through the pages in the report by either clicking on the pages listed below, or by using the keyword search tool below to find specific information within the annual report.-
 1
1 -
2
-
3
-
4
-
5
-
6
-
7
-
8
-
9
-
10
-
11
-
12
-
13
-
14
-
15
-
16
-
17
-
18
-
19
-
20
-
21
-
22
-
23
-
24
-
25
-
26
-
 27
27 -
 28
28 -
 29
29 -
 30
30 -
 31
31 -
 32
32 -
 33
33 -
 34
34 -
 35
35 -
 36
36 -
 37
37 -
 38
38 -
 39
39 -
 40
40 -
 41
41 -
 42
42 -
 43
43 -
 44
44 -
 45
45 -
 46
46 -
 47
47 -
48
-
49
-
50
-
51
-
52
-
53
-
54
-
55
-
56
-
57
-
58
-
59
-
60
-
61
-
62
-
63
-
64
-
65
-
66
-
67
-
68
-
69
-
70
-
71
-
72
-
73
-
74
-
75
-
76
-
77
-
78
-
79
-
80
-
81
-
82
-
83
-
84
-
85
-
86
-
87
-
88
-
89
-
90
-
91
-
92
-
93
-
94
-
95
-
96
-
97
-
98
-
99
-
100
-
101
-
102
-
103
-
104
-
105
-
106
-
107
-
108
-
109
-
110
-
111
-
112
-
113
-
114
-
115
-
116
 |
 |

ENTERGY CORPORATION AND SUBSIDIARIES 2010
Management’s Financial Discussion and Analysis continued
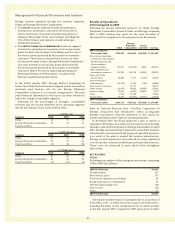
Parent & Other
Other income decreased primarily due to increases in the
distributions paid of $13 million to Entergy Louisiana and
$7 million to Entergy Gulf States Louisiana on investments in
preferred membership interests of Entergy Holdings Company, as
discussed above.
Interest charges decreased primarily due to lower borrowings,
including the redemption of $267 million of notes payable in
December 2009, as well as lower interest rates on borrowings
under Entergy Corporation’s revolving credit facility.
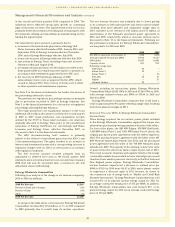
INCOME TAXES
The effective income tax rate for 2010 was 32.7%. The difference
in the effective income tax rate versus the statutory rate of 35%
in 2010 was primarily due to:
n a favorable Tax Court decision holding that the U.K. Windfall
Tax can be used as a credit for purposes of computing the
U.S. foreign tax credit, which allowed Entergy to reverse a
provision for uncertain tax positions of $43 million, included
in Parent and Other, on the issue. See Note 3 to the financial
statements for further discussion of this tax litigation;
n a $19 million tax benefit recorded in connection with Entergy’s
decision to unwind the infrastructure created for the planned
spin-off of its non-utility nuclear business; and
n the recognition of a $14 million Louisiana state income tax
benefit related to storm cost financing.
Partially offsetting the decreased effective income tax rate was a
charge of $16 million resulting from a change in tax law associated
with the recently enacted federal healthcare legislation, as
discussed below in “Critical Accounting Estimates” and state
income taxes and certain book and tax differences for Utility
plant items.
The effective income tax rate for 2009 was 33.6%. The reduction
in the effective income tax rate versus the federal statutory rate
of 35% in 2009 is primarily due to:
n recognition of a capital loss of $73.1 million resulting from the
sale of preferred stock of a Entergy Wholesale Commodities
subsidiary to a third party;
n reduction of a valuation allowance of $24.3 million on state
loss carryovers;
n reduction of a valuation allowance of $16.2 million on a
federal capital loss carryover;
n reduction of the provision for uncertain tax positions of
$15.2 million resulting from settlements and agreements with
taxing authorities;
n adjustment to state income taxes of $13.8 million for Entergy
Wholesale Commodities to reflect the effect of a change in the
methodology of computing Massachusetts state income taxes
as required by that state’s taxing authority; and
n additional deferred tax benefit of approximately $8 million
associated with writedowns on nuclear decommissioning
qualified trust securities.
These reductions were partially offset by increases related to
book and tax differences for utility plant items and state income
taxes at the Utility operating companies.
See Note 3 to the financial statements for a reconciliation of the
federal statutory rate of 35.0% to the effective income tax rates,
and for additional discussion regarding income taxes.
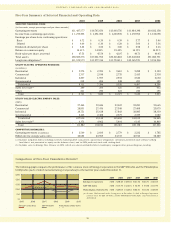
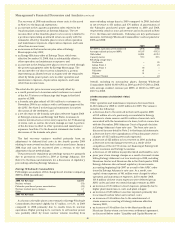
2009 Compared to 2008
Following are income statement variances for Utility, Entergy
Wholesale Commodities, Parent & Other, and Entergy comparing
2009 to 2008 showing how much the line item increased or
(decreased) in comparison to the prior period (in thousands):
Entergy
Wholesale Parent
Utility Commodities and Other Entergy
2008 Consolidated
Net Income (Loss) $605,144 $798,227 $(162,836) $1,240,535
Net revenue (operating
revenue less fuel expense,
purchased power, and
other regulatory
charges/credits) 105,167 (6,968) (765) 97,434
Other operation and
maintenance expenses (30,423) 86,131 (47,660) 8,048
Taxes other than
income taxes (2,173) 8,840 240 6,907
Depreciation and
amortization 37,409 14,917 (411) 51,915
Other income 74,456 (17,598) (56,437) 421
Interest charges 36,990 (22,479) (52,988) (38,477)
Other 16,658 12,546 1 29,205
Income taxes 17,401 32,612 (20,271) 29,742
2009 Consolidated
Net Income (Loss) $708,905 $641,094 $ (98,949) $1,251,050
Refer to “Selected Financial Data - Five-Year Comparison Of
Entergy Corporation And Subsidiaries” which accompanies
Entergy Corporation’s financial statements in this report for
further information with respect to operating statistics.
NET REVENUE
Utility
Following is an analysis of the change in net revenue comparing
2009 to 2008 (in millions):
2008 Net Revenue $4,589
Volume/weather 57
Retail electric price 33
Fuel recovery 31
Provision for regulatory proceedings (26)
Other 10
2009 Net Revenue $4,694
The volume/weather variance is primarily due to increased
electricity usage primarily during the unbilled sales period in
addition to the negative effect of Hurricane Gustav and Hurricane
Ike in 2008. Electricity usage by industrial customers decreased,
however, by 6%. The overall decline of the economy led to lower
usage affecting both the large customer industrial segment as well
as small and mid-sized industrial customers, who are also being
affected by overseas competition. The effect of the industrial
sales volume decrease is mitigated, however, by the fixed charge
basis of many industrial customers’ rates, which causes average
price per KWh sold to increase as the fixed charges are spread
over lower volume.
The retail electric price increase is primarily due to:
n rate increases that were implemented at Entergy Texas in
January 2009;
n an increase in the formula rate plan rider at Entergy Gulf
States Louisiana and Entergy Louisiana effective September
2008 and November 2009;
n the recovery of 2008 extraordinary storm costs at Entergy
Arkansas as approved by the APSC, effective January 2009.
35