Entergy 2010 Annual Report Download - page 108
Download and view the complete annual report
Please find page 108 of the 2010 Entergy annual report below. You can navigate through the pages in the report by either clicking on the pages listed below, or by using the keyword search tool below to find specific information within the annual report.-
 1
1 -
2
-
3
-
4
-
5
-
6
-
7
-
8
-
9
-
10
-
11
-
12
-
13
-
14
-
15
-
16
-
17
-
18
-
19
-
20
-
21
-
22
-
23
-
24
-
25
-
26
-
27
-
28
-
29
-
30
-
31
-
32
-
33
-
34
-
35
-
36
-
37
-
38
-
39
-
40
-
41
-
42
-
43
-
44
-
45
-
46
-
47
-
48
-
49
-
50
-
51
-
52
-
53
-
54
-
55
-
56
-
57
-
58
-
59
-
60
-
61
-
62
-
63
-
64
-
65
-
66
-
67
-
68
-
69
-
70
-
71
-
72
-
73
-
74
-
75
-
76
-
77
-
78
-
79
-
80
-
81
-
82
-
83
-
84
-
85
-
86
-
87
-
88
-
89
-
90
-
91
-
92
-
93
-
94
-
95
-
96
-
97
-
 98
98 -
 99
99 -
 100
100 -
 101
101 -
 102
102 -
 103
103 -
 104
104 -
 105
105 -
 106
106 -
 107
107 -
 108
108 -
 109
109 -
 110
110 -
 111
111 -
 112
112 -
 113
113 -
 114
114 -
 115
115 -
 116
116
 |
 |

Notes to Consolidated Financial Statements continued
Accounting standards establish a fair value hierarchy that
prioritizes the inputs used to measure fair value. The hierarchy
establishes the highest priority for unadjusted market quotes in
an active market for the identical asset or liability and the lowest
priority for unobservable inputs. The three levels of the fair value
hierarchy are:
n Level 1 - Level 1 inputs are unadjusted quoted prices in active
markets for identical assets or liabilities that the entity has
the ability to access at the measurement date. Active markets
are those in which transactions for the asset or liability
occur in sufficient frequency and volume to provide pricing
information on an ongoing basis. Level 1 primarily consists of
individually owned common stocks, cash equivalents, debt
instruments, and gas hedge contracts.
n Level 2 - Level 2 inputs are inputs other than quoted prices
included in Level 1 that are, either directly or indirectly,
observable for the asset or liability at the measurement date.
Assets are valued based on prices derived by independent
third parties that use inputs such as benchmark yields,
reported trades, broker/dealer quotes, and issuer spreads.
Prices are reviewed and can be challenged with the
independent parties and/or overridden by Entergy if it is
believed such would be more reflective of fair value. Level 2
inputs include the following:
n quoted prices for similar assets or liabilities in
active markets;
n quoted prices for identical assets or liabilities in
inactive markets;
n inputs other than quoted prices that are observable
for the asset or liability; or
n inputs that are derived principally from or corroborated
by observable market data by correlation or other means.
Level 2 consists primarily of individually owned debt instruments
or shares in common trusts. Common trust funds are stated
at estimated fair value based on the fair market value of the
underlying investments.
n Level 3 - Level 3 inputs are pricing inputs that are
generally less observable or unobservable from objective
sources. These inputs are used with internally developed
methodologies to produce management’s best estimate of fair
value for the asset or liability. Level 3 consists primarily of
derivative power contracts used as cash flow hedges of power
sales at merchant power plants.
The values for the cash flow hedges that are recorded as derivative
contract assets or liabilities are based on both observable inputs
including public market prices and unobservable inputs such as
model-generated prices for longer-term markets and are classified
as Level 3 assets and liabilities. The amounts reflected as the fair
value of derivative assets or liabilities are based on the estimated
amount that the contracts are in-the-money at the balance sheet
date (treated as an asset) or out-of-the-money at the balance sheet
date (treated as a liability) and would equal the estimated amount
receivable or payable by Entergy if the contracts were settled at
that date. These derivative contracts include cash flow hedges
that swap fixed for floating cash flows for sales of the output
from Entergy’s Entergy Wholesale Commodities business. The
fair values are based on the mark-to-market comparison between
the fixed contract prices and the floating prices determined each
period from a combination of quoted forward power market
prices for the period for which such curves are available, and
model-generated prices using quoted forward gas market curves
and estimates regarding heat rates to convert gas to power and
the costs associated with the transportation of the power from
the plants’ bus bar to the contract’s point of delivery, generally
a power market hub, for the period thereafter. The differences
between the fixed price in the swap contract and these market-
related prices multiplied by the volume specified in the contract
and discounted at the counterparties’ credit adjusted risk free
rate are recorded as derivative contract assets or liabilities.
As of December 31, 2010, Entergy had in-the-money derivative
contracts with a fair value of $214 million with counterparties
or their guarantor who are all currently investment grade. $17
million of the derivative contracts as of December 31, 2010 are
out-of-the-money contracts supported by corporate guarantees,
which would require additional cash or letters of credit in the
event of a decrease in Entergy Corporation’s credit rating to
below investment grade.
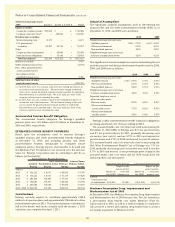
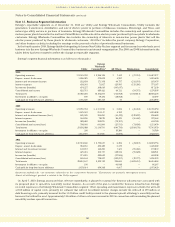
The following table sets forth, by level within the fair value
hierarchy, Entergy’s assets and liabilities that are accounted for
at fair value on a recurring basis as of December 31, 2010 and
December 31, 2009. The assessment of the significance of a
particular input to a fair value measurement requires judgment
and may affect their placement within the fair value hierarchy
levels (in millions):
2010 Level 1 Level 2 Level 3 Total
Assets:
Temporary cash investments $1,218 $ – $ – $1,218
Decommissioning trust funds:(a)
Equity securities 387 1,689 – 2,076
Debt securities 497 1,023 – 1,520
Power contracts – – 214 214
Securitization recovery trust account 43 – – 43
Storm reserve escrow account 329 – – 329
$2,474 $2,712 $214 $5,400
Liabilities:
Power contracts $ – $ – $ 17 $ 17
Gas hedge contracts $ 2 $ – $ – $ 2
$ 2 $ – $ 17 $ 19
2009 Level 1 Level 2 Level 3 Total
Assets:
Temporary cash investments $1,624 $ – $ – $1,624
Decommissioning trust funds:(a)
Equity securities 528 1,260 – 1,788
Debt securities 443 980 – 1,423
Power contracts – – 200 200
Securitization recovery trust account 13 – – 13
Gas hedge contracts 8 – – 8
Other investments 42 – – 42
$2,658 $2,240 $200 $5,098
(a) The decommissioning trust funds hold equity and fixed income securities.
Equity securities are invested to approximate the returns of major market
indexes. Fixed income securities are held in various governmental and
corporate securities with an average coupon rate of 4.34%. See Note 17
for additional information on the investment portfolios.
106