Entergy 2010 Annual Report Download - page 34
Download and view the complete annual report
Please find page 34 of the 2010 Entergy annual report below. You can navigate through the pages in the report by either clicking on the pages listed below, or by using the keyword search tool below to find specific information within the annual report.-
 1
1 -
2
-
3
-
4
-
5
-
6
-
7
-
8
-
9
-
10
-
11
-
12
-
13
-
14
-
15
-
16
-
17
-
18
-
19
-
20
-
21
-
22
-
23
-
 24
24 -
 25
25 -
 26
26 -
 27
27 -
 28
28 -
 29
29 -
 30
30 -
 31
31 -
 32
32 -
 33
33 -
 34
34 -
 35
35 -
 36
36 -
 37
37 -
 38
38 -
 39
39 -
 40
40 -
 41
41 -
 42
42 -
 43
43 -
 44
44 -
45
-
46
-
47
-
48
-
49
-
50
-
51
-
52
-
53
-
54
-
55
-
56
-
57
-
58
-
59
-
60
-
61
-
62
-
63
-
64
-
65
-
66
-
67
-
68
-
69
-
70
-
71
-
72
-
73
-
74
-
75
-
76
-
77
-
78
-
79
-
80
-
81
-
82
-
83
-
84
-
85
-
86
-
87
-
88
-
89
-
90
-
91
-
92
-
93
-
94
-
95
-
96
-
97
-
98
-
99
-
100
-
101
-
102
-
103
-
104
-
105
-
106
-
107
-
108
-
109
-
110
-
111
-
112
-
113
-
114
-
115
-
116
 |
 |

Management’s Financial Discussion and Analysis
Entergy operates primarily through two business segments:
Utility and Entergy Wholesale Commodities:
n The UTILITY business segment includes the generation,
transmission, distribution, and sale of electric power in
service territories in four states that include portions of
Arkansas, Mississippi, Texas, and Louisiana, including the
City of New Orleans; and operates a small natural gas
distribution business.
n The ENTERGY WHOLESALE COMMODITIES business segment
includes the ownership and operation of six nuclear power
plants located in the northern United States and the sale of
the electric power produced by those plants to wholesale
customers. This business also provides services to other
nuclear power plant owners. Entergy Wholesale Commodities
also owns interests in non-nuclear power plants that sell
the electric power produced by those plants to wholesale
customers while it focuses on improving operating and
financial performance of these plants, consistent with
Entergy’s market-based point-of-view.
In the fourth quarter 2010, Entergy finished integrating its
former Non-Utility Nuclear business segment and its non-nuclear
wholesale asset business into the new Entergy Wholesale
Commodities business in an internal reorganization. The prior
period financial information in this report has been restated to
reflect the change in reportable segments.
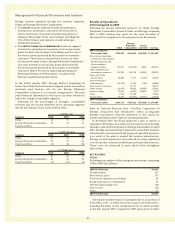
Following are the percentages of Entergy’s consolidated
revenues and net income generated by its operating segments
and the percentage of total assets held by them:
% of Revenue
Segment 2010 2009 2008
Utility 78 75 79
Entergy Wholesale Commodities 22 25 21
Parent and Other – – –
% of Net Income
Segment 2010 2009 2008
Utility 65 57 49
Entergy Wholesale Commodities 39 51 64
Parent and Other (4) (8) (13)
% of Total Assets
Segment 2010 2009 2008
Utility 80 80 79
Entergy Wholesale Commodities 26 30 25
Parent and Other (6) (10) (4)
Results of Operations
2010 Compared to 2009
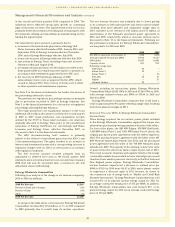
Following are income statement variances for Utility, Entergy
Wholesale Commodities, Parent & Other, and Entergy comparing
2010 to 2009 showing how much the line item increased or
(decreased) in comparison to the prior period (in thousands):
Entergy
Wholesale Parent
Utility Commodities and Other Entergy
2009 Consolidated
Net Income (Loss) $708,905 $641,094 $(98,949) $1,251,050
Net revenue (operating
revenue less fuel expense,
purchased power, and
other regulatory
charges/credits) 357,211 (163,518) 8,622 202,315
Other operation and
maintenance expenses 112,384 124,758 (18,550) 218,592
Taxes other than
income taxes 28,872 2,717 (1,149) 30,440
Depreciation and
amortization (24,112) 11,413 (182) (12,881)
Gain on sale of business – 44,173 – 44,173
Other income (14,915) 66,222 (25,681) 25,626
Interest charges 31,035 (6,461) (19,851) 4,723
Other 7,758 19,728 – 27,486
Income taxes 65,545 (53,606) (27,440) (15,501)
2010 Consolidated
Net Income (Loss) $829,719 $489,422 $(48,836) $1,270,305
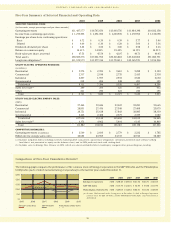
Refer to “Selected Financial Data - Five-Year Comparison Of
Entergy Corporation And Subsidiaries” which accompanies
Entergy Corporation’s financial statements in this report for
further information with respect to operating statistics.
In November 2007 the Board approved a plan to pursue a
separation of Entergy’s non-utility nuclear business from Entergy
through a spin-off of the business to Entergy shareholders. In April
2010, Entergy announced that it planned to unwind the business
infrastructure associated with the proposed spin-off transaction.
As a result of the plan to unwind the business infrastructure,
Entergy recorded expenses for the write-off of certain capitalized
costs incurred in connection with the planned spin-off transaction.
These costs are discussed in more detail below throughout
this section.
NET REVENUE
Utility
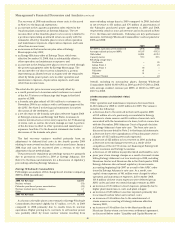
Following is an analysis of the change in net revenue, comparing
2010 to 2009 (in millions):
2009 Net Revenue $4,694
Volume/weather 231
Retail electric price 137
Provision for regulatory proceedings 26
Rough production cost equalization 19
ANO decommissioning trust (24)
Fuel recovery (44)
Other 12
2010 Net Revenue $5,051
The volume/weather variance is primarily due to an increase of
8,362 GWh, or 8%, in billed electricity usage in all retail sectors,
including the effect on the residential sector of colder weather
in the first quarter 2010 compared to 2009 and warmer weather
32