Entergy 2010 Annual Report Download - page 20
Download and view the complete annual report
Please find page 20 of the 2010 Entergy annual report below. You can navigate through the pages in the report by either clicking on the pages listed below, or by using the keyword search tool below to find specific information within the annual report.-
 1
1 -
2
-
3
-
4
-
5
-
6
-
7
-
8
-
9
-
 10
10 -
 11
11 -
 12
12 -
 13
13 -
 14
14 -
 15
15 -
 16
16 -
 17
17 -
 18
18 -
 19
19 -
 20
20 -
 21
21 -
 22
22 -
 23
23 -
 24
24 -
 25
25 -
 26
26 -
 27
27 -
 28
28 -
 29
29 -
 30
30 -
31
-
32
-
33
-
34
-
35
-
36
-
37
-
38
-
39
-
40
-
41
-
42
-
43
-
44
-
45
-
46
-
47
-
48
-
49
-
50
-
51
-
52
-
53
-
54
-
55
-
56
-
57
-
58
-
59
-
60
-
61
-
62
-
63
-
64
-
65
-
66
-
67
-
68
-
69
-
70
-
71
-
72
-
73
-
74
-
75
-
76
-
77
-
78
-
79
-
80
-
81
-
82
-
83
-
84
-
85
-
86
-
87
-
88
-
89
-
90
-
91
-
92
-
93
-
94
-
95
-
96
-
97
-
98
-
99
-
100
-
101
-
102
-
103
-
104
-
105
-
106
-
107
-
108
-
109
-
110
-
111
-
112
-
113
-
114
-
115
-
116
 |
 |
Pursuing Effective Regulatory Constructs
The utility operating companies’ approach to regulation is multi-
dimensional and includes Formula Rate Plans, capacity and
transmission riders, storm securitization and acquisition preapprovals.
We believe that FRPs are effi cient and effective regulatory constructs,
enabling the utility operating companies to earn a return on equity
suffi cient to attract capital to support investment while providing timely
resets if earnings fall above or below a specifi ed band.
Four of Entergy’s utility operating companies operate under FRPs –
Entergy Gulf States Louisiana, Entergy Louisiana, Entergy Mississippi
and Entergy New Orleans. In early 2010, Entergy Mississippi obtained a
revised FRP that simplifi es setting base rates, stabilizes customer bills
and provides a return on capital opportunity similar to that of other
Mississippi utilities. Entergy New Orleans completed its fi rst FRP fi ling
under its new structure, resulting in an $18 million electric rate decrease
on an annualized basis. In Louisiana, both utility operating companies
earned within their authorized ROE bandwidths for the 2009 test year,
following one-time ROE midpoint resets for the 2008 test year.
In Arkansas and Texas, two jurisdictions that use periodic rate cases,
signifi cant progress was realized in 2010. In June, the Arkansas Public
Service Commission approved a settlement and subsequent compliance
tariffs that provide for a $63.7 million rate increase and authorized an
ROE of 10.2 percent, up from 9.9 percent previously. This is the fi rst
base rate increase approved for Entergy Arkansas since 1985. In Texas,
the Public Utility Commission of Texas unanimously approved a
$68 million rate increase in December and authorized an ROE of
10.125 percent. In addition, the rate case set a baseline for future
annual fi lings under a transmission rider. However, Entergy Texas
intends to continue to work with Texas stakeholders to achieve rate
recovery mechanisms that permit full recognition of its cost structure
and investment and power needs to meet growing customer demand.
The utility operating companies have learned many practical lessons
over the past 12 years in how to effectively manage storm risk. Event
risk from hurricanes and other major storms was reduced after securing
recovery of $2.4 billion in storm costs, primarily through the use of
securitization, and establishing cash storm reserves of nearly $330
million as of Dec. 31, 2010. This track record, along with three state
evergreen securitization laws in place, provides a recovery framework
should it be needed in the future.
Going forward, the utility operating companies will work toward
creating a constructive regulatory environment that benefi ts their
customers and shareholders.
Investing in Strategic Resources
Through the portfolio transformation strategy, the Utility continues
to pursue opportunities to procure the right generating technologies
for its customers in the most effi cient manner possible. It continues to
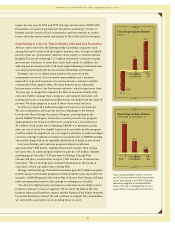
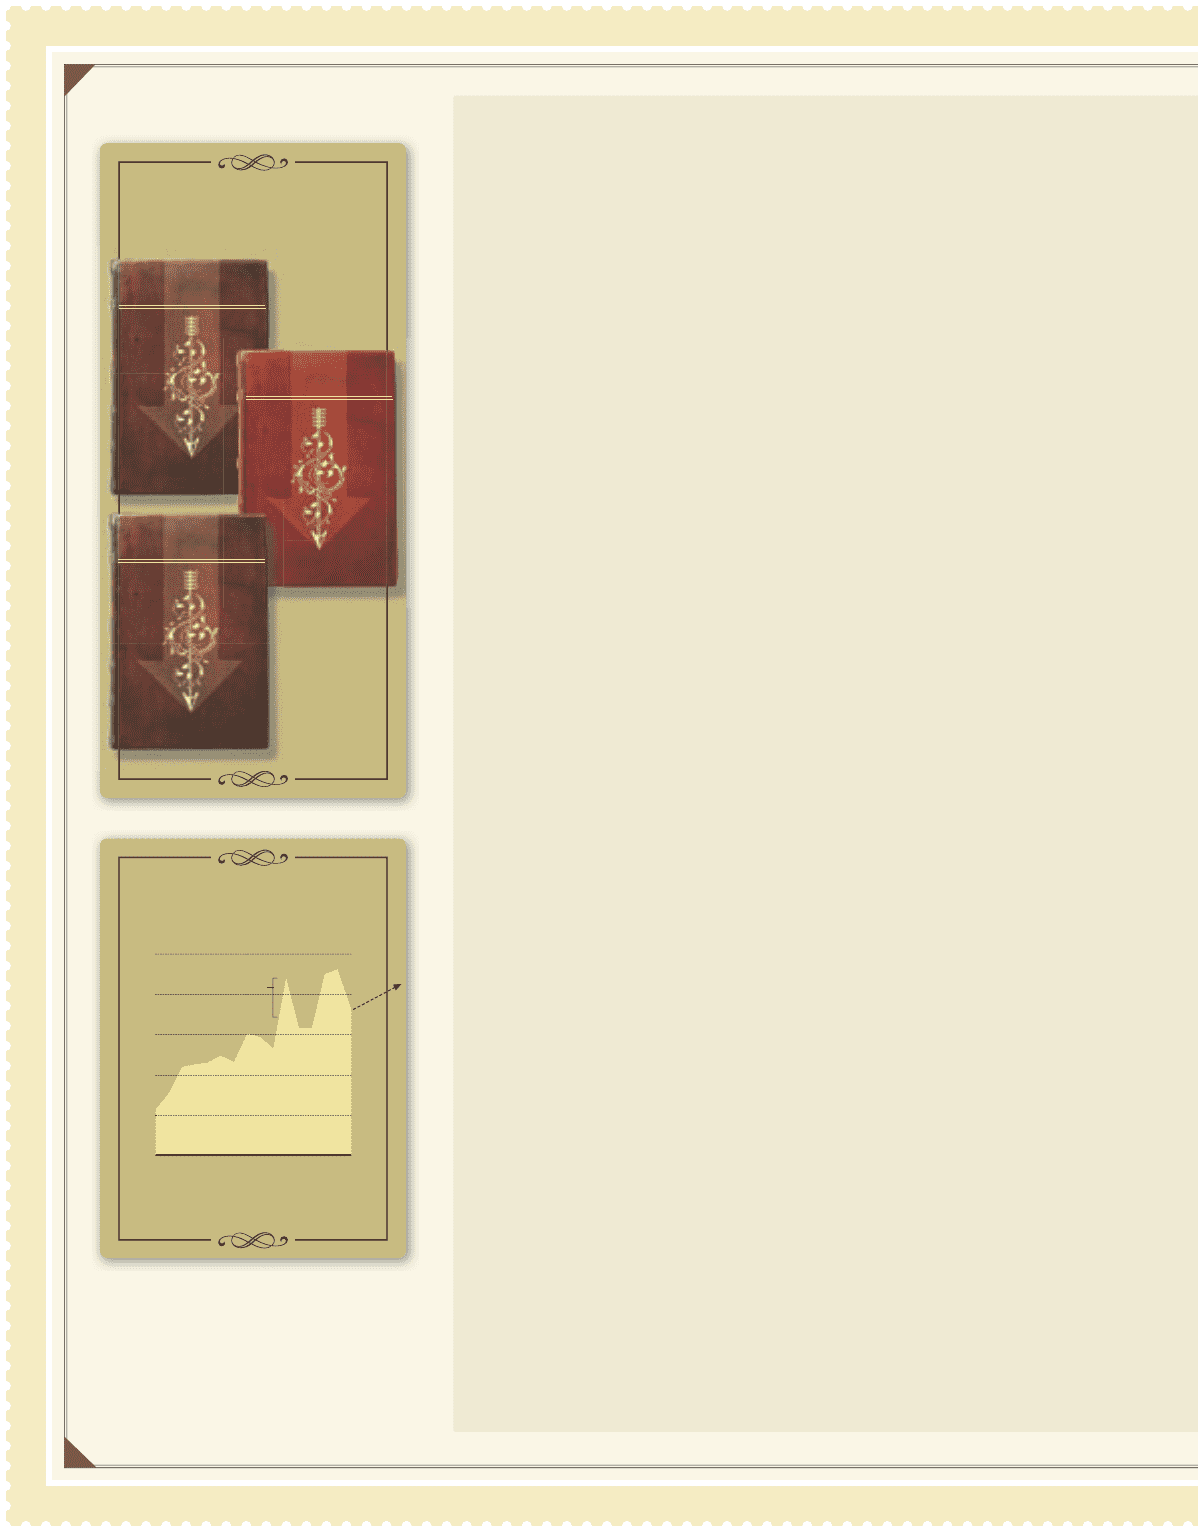
Over the past 12 years and again in 2010,
the utility operating companies
improved
their customer service performance
and identifi ed productive investment
opportunities to enable continued
delivery of reliable, affordable power.
Customer Service Metrics
1998 vs. 2010, % change
53%
Outage
Frequency
33%
Outage
Duration
89%
Regulatory
Outage Complaints
Utility Capital Plan
1998-2013E, $ in billions
0
2.0
2.5
1.5
1.0
0.5
Hurricanes
Gustav/Ike
13E
10
07
04
01
98
Investment Opportunity
18