Entergy 2010 Annual Report Download - page 103
Download and view the complete annual report
Please find page 103 of the 2010 Entergy annual report below. You can navigate through the pages in the report by either clicking on the pages listed below, or by using the keyword search tool below to find specific information within the annual report.-
 1
1 -
2
-
3
-
4
-
5
-
6
-
7
-
8
-
9
-
10
-
11
-
12
-
13
-
14
-
15
-
16
-
17
-
18
-
19
-
20
-
21
-
22
-
23
-
24
-
25
-
26
-
27
-
28
-
29
-
30
-
31
-
32
-
33
-
34
-
35
-
36
-
37
-
38
-
39
-
40
-
41
-
42
-
43
-
44
-
45
-
46
-
47
-
48
-
49
-
50
-
51
-
52
-
53
-
54
-
55
-
56
-
57
-
58
-
59
-
60
-
61
-
62
-
63
-
64
-
65
-
66
-
67
-
68
-
69
-
70
-
71
-
72
-
73
-
74
-
75
-
76
-
77
-
78
-
79
-
80
-
81
-
82
-
83
-
84
-
85
-
86
-
87
-
88
-
89
-
90
-
91
-
92
-
 93
93 -
 94
94 -
 95
95 -
 96
96 -
 97
97 -
 98
98 -
 99
99 -
 100
100 -
 101
101 -
 102
102 -
 103
103 -
 104
104 -
 105
105 -
 106
106 -
 107
107 -
 108
108 -
 109
109 -
 110
110 -
 111
111 -
 112
112 -
 113
113 -
114
-
115
-
116
 |
 |

ENTERGY CORPORATION AND SUBSIDIARIES 2010
Notes to Consolidated Financial Statements continued
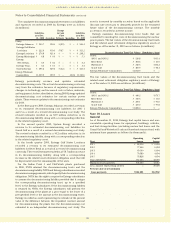
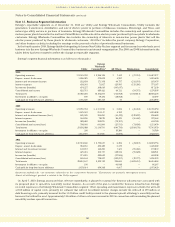
Note 13. Business Segment Information
Entergy’s reportable segments as of December 31, 2010 are Utility and Entergy Wholesale Commodities. Utility includes the
generation, transmission, distribution, and sale of electric power in portions of Arkansas, Louisiana, Mississippi, and Texas, and
natural gas utility service in portions of Louisiana. Entergy Wholesale Commodities includes the ownership and operation of six
nuclear power plants located in the northern United States and the sale of the electric power produced by those plants to wholesale
customers. Entergy Wholesale Commodities also includes the ownership of interests in non-nuclear power plants that sell the
electric power produced by those plants to wholesale customers. “All Other” includes the parent company, Entergy Corporation,
and other business activity, including the earnings on the proceeds of sales of previously-owned businesses.
In the fourth quarter 2010, Entergy finished integrating its former Non-Utility Nuclear segment and its non-nuclear wholesale asset
business into the new Entergy Wholesale Commodities business in an internal reorganization. The 2009 and 2008 information in the
tables below has been restated to reflect the change in reportable segments.
Entergy’s segment financial information is as follows (in thousands):
Entergy
Wholesale
Utility Commodities* All Others Eliminations Consolidated
2010
Operating revenues $ 8,941,332 $ 2,566,156 $ 7,442 $ (27,353) $11,487,577
Deprec., amort. & decomm. 1,006,385 270,658 4,587 – 1,281,630
Interest and investment income 182,493 171,158 44,757 (212,953) 185,455
Interest expense 493,241 71,817 129,505 (119,396) 575,167
Income tax (benefits) 454,227 268,649 (105,637) – 617,239
Consolidated net income 829,719 489,422 44,721 (93,557) 1,270,305
Total assets 31,080,240 10,102,817 (714,968) (1,782,813) 38,685,276
Investment in affiliates - at equity 199 59,456 (18,958) – 40,697
Cash paid for long-lived asset additions 1,766,609 687,313 75 – 2,453,997
2009
Operating revenues $ 8,055,353 $ 2,711,078 $ 5,682 $ (26,463) $10,745,650
Deprec., amort. & decomm. 1,025,922 251,147 4,769 – 1,281,838
Interest and investment income (loss) 180,505 196,492 (10,470) (129,899) 236,628
Interest expense 462,206 78,278 86,420 (56,460) 570,444
Income tax (benefits) 388,682 322,255 (78,197) – 632,740
Consolidated net income (loss) 708,905 641,094 (25,511) (73,438) 1,251,050
Total assets 29,892,088 11,134,791 (646,756) (2,818,170) 37,561,953
Investment in affiliates - at equity 200 – 39,380 – 39,580
Cash paid for long-lived asset additions 1,872,997 661,596 (5,874) – 2,528,719
2008
Operating revenues $10,318,630 $ 2,793,637 $ 6,456 $ (24,967) $13,093,756
Deprec., amort. & decomm. 984,651 230,439 5,179 – 1,220,269
Interest and investment income 122,657 163,200 7,421 (95,406) 197,872
Interest expense 425,216 100,757 138,576 (55,628) 608,921
Income tax (benefits) 371,281 289,643 (57,926) – 602,998
Consolidated net income (loss) 605,144 798,227 (123,057) (39,779) 1,240,535
Total assets 28,810,147 9,295,722 334,600 (1,823,651) 36,616,818
Investment in affiliates - at equity 199 – 66,048 – 66,247
Cash paid for long-lived asset additions 2,478,014 490,348 6,667 – 2,975,029
Businesses marked with * are sometimes referred to as the “competitive businesses.” Eliminations are primarily intersegment activity.
Almost all of Entergy’s goodwill is related to the Utility segment.
On April 5, 2010, Entergy announced that, effective immediately, it planned to unwind the business infrastructure associated with
its proposed plan to spin-off its non-utility nuclear business. As a result of the plan to unwind the business infrastructure, Entergy
recorded expenses in the Entergy Wholesale Commodities segment. Other operating and maintenance expense includes the write-off
of $64 million of capital costs, primarily for software that will not be utilized. Interest charges include the write-off of $39 million of
debt financing costs, primarily incurred for the $1.2 billion credit facility related to the planned spin-off of Entergy’s non-utility nuclear
business that will not be used. Approximately $16 million of other costs were incurred in 2010 in connection with unwinding the planned
non-utility nuclear spin-off transaction.
101