Entergy 2010 Annual Report Download - page 102
Download and view the complete annual report
Please find page 102 of the 2010 Entergy annual report below. You can navigate through the pages in the report by either clicking on the pages listed below, or by using the keyword search tool below to find specific information within the annual report.-
 1
1 -
2
-
3
-
4
-
5
-
6
-
7
-
8
-
9
-
10
-
11
-
12
-
13
-
14
-
15
-
16
-
17
-
18
-
19
-
20
-
21
-
22
-
23
-
24
-
25
-
26
-
27
-
28
-
29
-
30
-
31
-
32
-
33
-
34
-
35
-
36
-
37
-
38
-
39
-
40
-
41
-
42
-
43
-
44
-
45
-
46
-
47
-
48
-
49
-
50
-
51
-
52
-
53
-
54
-
55
-
56
-
57
-
58
-
59
-
60
-
61
-
62
-
63
-
64
-
65
-
66
-
67
-
68
-
69
-
70
-
71
-
72
-
73
-
74
-
75
-
76
-
77
-
78
-
79
-
80
-
81
-
82
-
83
-
84
-
85
-
86
-
87
-
88
-
89
-
90
-
91
-
 92
92 -
 93
93 -
 94
94 -
 95
95 -
 96
96 -
 97
97 -
 98
98 -
 99
99 -
 100
100 -
 101
101 -
 102
102 -
 103
103 -
 104
104 -
 105
105 -
 106
106 -
 107
107 -
 108
108 -
 109
109 -
 110
110 -
 111
111 -
 112
112 -
113
-
114
-
115
-
116
 |
 |

Notes to Consolidated Financial Statements continued
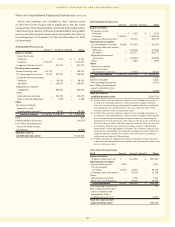
The weighted-average grant-date fair value of options granted during the year was $12.47 for 2009 and $14.41 for 2008. The total intrinsic
value of stock options exercised was $36.6 million during 2010, $35.6 million during 2009, and $63.7 million during 2008. The intrinsic
value, which has no effect on net income, of the stock options exercised is calculated by the difference in Entergy Corporation’s
common stock price on the date of exercise and the exercise price of the stock options granted. Because Entergy’s year-end stock price
is less than the weighted average exercise price, the aggregate intrinsic value of outstanding stock options as of December 31, 2010 was
zero. The intrinsic value of “in the money” stock options is $87 million as of December 31, 2010. Entergy recognizes compensation cost
over the vesting period of the options based on their grant-date fair value. The total fair value of options that vested was approximately
$21 million during 2010, $22 million during 2009, and $18 million during 2008.
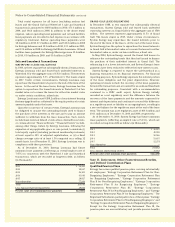
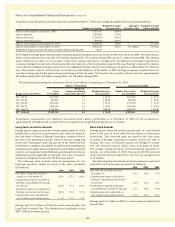
The following table summarizes information about stock options outstanding as of December 31, 2010:
Stock-based compensation cost related to non-vested stock options outstanding as of December 31, 2010 not yet recognized is
approximately $18 million and is expected to be recognized on a weighted-average period of 1.8 years.
Options outstanding as of January 1, 2010
Options granted
Options exercised
Options forfeited/expired
Options outstanding as of December 31, 2010
Options exercisable as of December 31, 2010
Weighted-average grant-date fair value of options granted during 2010
Options Outstanding Options Exercisable
Weighted-
As of Average Remaining Weighted-Average Number Exercisable Weighted-Average
Range of Exercise Prices 12/31/2010 Contractual Life-Yrs. Exercise Price at 12/31/2010 Exercise Price
$37 - $50.99 2,472,520 1.3 $ 42.12 2,472,520 $ 42.12
$51 - $64.99 984,055 3.2 $ 58.58 984,055 $ 58.58
$65 - $78.99 4,616,768 4.1 $ 73.10 2,797,769 $ 70.40
$79 - $91.99 1,650,516 6.1 $ 91.81 1,650,516 $ 91.81
$92 - $108.20 1,501,866 7.1 $108.20 1,050,387 $108.20
$37 - $108.20 11,225,725 4.1 $ 72.45 8,955,247 $ 69.67
A summary of stock option activity for the year ended December 31, 2010 and changes during the year are presented below:
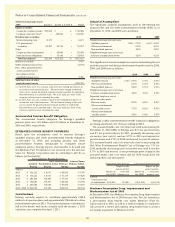
Long-Term Incentive Awards
Entergy grants long-term incentive awards earned under its stock
benefit plans in the form of performance units, which are equal to
the cash value of shares of Entergy Corporation common stock at
the end of the performance period, which is the last trading day
of the year. Performance units will pay out to the extent that the
performance conditions are satisfied. In addition to the potential for
equivalent share appreciation or depreciation, performance units will
earn the cash equivalent of the dividends paid during the three-year
performance period applicable to each plan. The costs of incentive
awards are charged to income over the three-year period.
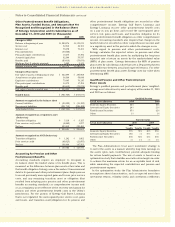
The following table includes financial information for the
long-term incentive awards for each of the years presented
(in millions):
2010 2009 2008
Fair value of long-term incentive
awards as of December 31, $ 10.1 $17.2 $40.9
Compensation expense included in
Entergy’s consolidated net income
for the year $(0.9) $ 5.6 $19.7
Tax benefit (expense) recognized in
Entergy’s net income for the year $(0.4) $ 2.2 $ 7.6
Compensation cost capitalized as
part of fixed assets and inventory $ 0.1 $ 1.0 $ 4.7
Entergy paid $6.3 million in 2010 for awards earned under the
Long-Term Incentive Plan. The distribution is applicable to the
2007 - 2009 performance period.
Restricted Awards
Entergy grants restricted awards earned under its stock benefit
plans in the form of stock units that are subject to time-based
restrictions. The restricted units are equal to the cash value
of shares of Entergy Corporation common stock at the time of
vesting. The costs of restricted awards are charged to income
over the restricted period, which varies from grant to grant.
The average vesting period for restricted awards granted is 37
months. As of December 31, 2010, there were 218,921 unvested
restricted units that are expected to vest over an average period
of 16 months.
The following table includes financial information for restricted
awards for each of the years presented (in millions):
2010 2009 2008
Fair value of restricted awards at
December 31, $8.3 $4.6 $7.5
Compensation expense included in
Entergy’s consolidated net income
for the year $3.9 $2.0 $2.0
Tax benefit recognized in Entergy’s
consolidated net income for the year $1.5 $0.8 $0.8
Compensation cost capitalized as
part of fixed assets and inventory $0.9 $0.5 $0.4
Entergy paid $1.1 million in 2010 for awards under the Restricted
Awards Plan.
Weighted-Average Aggregate Weighted-Average
Number of Options Exercise Price Intrinsic Value Contractual Life
11,321,071 $69.64
1,407,900 $77.10
(1,113,411) $45.63
(389,835) $84.35
11,225,725 $72.45 $ – 4.1 years
8,955,247 $69.67 $10 million 4.2 years
$13.18
100