Entergy 2010 Annual Report Download - page 58
Download and view the complete annual report
Please find page 58 of the 2010 Entergy annual report below. You can navigate through the pages in the report by either clicking on the pages listed below, or by using the keyword search tool below to find specific information within the annual report.-
 1
1 -
2
-
3
-
4
-
5
-
6
-
7
-
8
-
9
-
10
-
11
-
12
-
13
-
14
-
15
-
16
-
17
-
18
-
19
-
20
-
21
-
22
-
23
-
24
-
25
-
26
-
27
-
28
-
29
-
30
-
31
-
32
-
33
-
34
-
35
-
36
-
37
-
38
-
39
-
40
-
41
-
42
-
43
-
44
-
45
-
46
-
47
-
 48
48 -
 49
49 -
 50
50 -
 51
51 -
 52
52 -
 53
53 -
 54
54 -
 55
55 -
 56
56 -
 57
57 -
 58
58 -
 59
59 -
 60
60 -
 61
61 -
 62
62 -
 63
63 -
 64
64 -
 65
65 -
 66
66 -
 67
67 -
 68
68 -
69
-
70
-
71
-
72
-
73
-
74
-
75
-
76
-
77
-
78
-
79
-
80
-
81
-
82
-
83
-
84
-
85
-
86
-
87
-
88
-
89
-
90
-
91
-
92
-
93
-
94
-
95
-
96
-
97
-
98
-
99
-
100
-
101
-
102
-
103
-
104
-
105
-
106
-
107
-
108
-
109
-
110
-
111
-
112
-
113
-
114
-
115
-
116
 |
 |

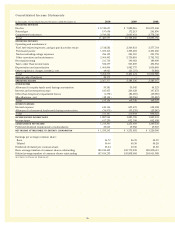
Consolidated Income Statements
In thousands, except share data, for the years ended December 31, 2010 2009 2008
OPERATING REVENUES
Electric $ 8,740,637 $ 7,880,016 $10,073,160
Natural gas 197,658 172,213 241,856
Competitive businesses 2,549,282 2,693,421 2,778,740
Total 11,487,577 10,745,650 13,093,756
OPERATING EXPENSES
Operating and maintenance:
Fuel, fuel-related expenses, and gas purchased for resale 2,518,582 2,309,831 3,577,764
Purchased power 1,659,416 1,395,203 2,491,200
Nuclear refueling outage expenses 256,123 241,310 221,759
Other operation and maintenance 2,969,402 2,750,810 2,742,762
Decommissioning 211,736 199,063 189,409
Taxes other than income taxes 534,299 503,859 496,952
Depreciation and amortization 1,069,894 1,082,775 1,030,860
Other regulatory charges (credits) - net 44,921 (21,727) 59,883
Total 9,264,373 8,461,124 10,810,589
Gain on sale of business 44,173 – –
OPERATING INCOME 2,267,377 2,284,526 2,283,167
OTHER INCOME
Allowance for equity funds used during construction 59,381 59,545 44,523
Interest and investment income 185,455 236,628 197,872
Other than temporary impairment losses (1,378) (86,069) (49,656)
Miscellaneous - net (48,124) (40,396) (23,452)
Total 195,334 169,708 169,287
INTEREST EXPENSE
Interest expense 610,146 603,679 634,188
Allowance for borrowed funds used during construction (34,979) (33,235) (25,267)
Total 575,167 570,444 608,921
INCOME BEFORE INCOME TAXES 1,887,544 1,883,790 1,843,533
Income taxes 617,239 632,740 602,998
CONSOLIDATED NET INCOME 1,270,305 1,251,050 1,240,535
Preferred dividend requirements of subsidiaries 20,063 19,958 19,969
NET INCOME ATTRIBUTABLE TO ENTERGY CORPORATION $ 1,250,242 $ 1,231,092 $ 1,220,566
Earnings per average common share:
Basic $6.72 $6.39 $6.39
Diluted $6.66 $6.30 $6.20
Dividends declared per common share $3.24 $3.00 $3.00
Basic average number of common shares outstanding 186,010,452 192,772,032 190,925,613
Diluted average number of common shares outstanding 187,814,235 195,838,068 201,011,588
See Notes to Financial Statements.
56