Entergy 2010 Annual Report Download - page 63
Download and view the complete annual report
Please find page 63 of the 2010 Entergy annual report below. You can navigate through the pages in the report by either clicking on the pages listed below, or by using the keyword search tool below to find specific information within the annual report.-
 1
1 -
2
-
3
-
4
-
5
-
6
-
7
-
8
-
9
-
10
-
11
-
12
-
13
-
14
-
15
-
16
-
17
-
18
-
19
-
20
-
21
-
22
-
23
-
24
-
25
-
26
-
27
-
28
-
29
-
30
-
31
-
32
-
33
-
34
-
35
-
36
-
37
-
38
-
39
-
40
-
41
-
42
-
43
-
44
-
45
-
46
-
47
-
48
-
49
-
50
-
51
-
52
-
 53
53 -
 54
54 -
 55
55 -
 56
56 -
 57
57 -
 58
58 -
 59
59 -
 60
60 -
 61
61 -
 62
62 -
 63
63 -
 64
64 -
 65
65 -
 66
66 -
 67
67 -
 68
68 -
 69
69 -
 70
70 -
 71
71 -
 72
72 -
 73
73 -
74
-
75
-
76
-
77
-
78
-
79
-
80
-
81
-
82
-
83
-
84
-
85
-
86
-
87
-
88
-
89
-
90
-
91
-
92
-
93
-
94
-
95
-
96
-
97
-
98
-
99
-
100
-
101
-
102
-
103
-
104
-
105
-
106
-
107
-
108
-
109
-
110
-
111
-
112
-
113
-
114
-
115
-
116
 |
 |

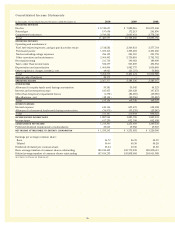
ENTERGY CORPORATION AND SUBSIDIARIES 2010
Consolidated Statements of Cash Flows
In thousands, for the years ended December 31, 2010 2009 2008
FINANCING ACTIVITIES
Proceeds from the issuance of:
Long-term debt 3,870,694 2,003,469 3,456,695
Common stock and treasury stock 51,163 28,198 34,775
Retirement of long-term debt (4,178,127) (1,843,169) (2,486,806)
Repurchase of common stock (878,576) (613,125) (512,351)
Redemption of preferred stock – (1,847) –
Changes in credit borrowings - net (8,512) (25,000) 30,000
Dividends paid:
Common stock (603,854) (576,956) (573,045)
Preferred equity (20,063) (19,958) (20,025)
Net cash flow used in financing activities (1,767,275) (1,048,388) (70,757)
Effect of exchange rates on cash and cash equivalents 338 (1,316) 3,288
Net increase (decrease) in cash and cash equivalents (415,079) (210,940) 666,763
Cash and cash equivalents at beginning of period 1,709,551 1,920,491 1,253,728
Cash and cash equivalents at end of period $ 1,294,472 $ 1,709,551 $ 1,920,491
SUPPLEMENTAL DISCLOSURE OF CASH FLOW INFORMATION
Cash paid during the period for:
Interest - net of amount capitalized $ 540,352 $ 568,417 $ 612,288
Income taxes $ 32,144 $ 43,057 $ 137,234
Noncash financing activities:
Long-term debt retired (equity unit notes) – $ (500,000) –
Common stock issued in settlement of equity unit purchase contracts – $ 500,000 –
See Notes to Financial Statements.
61