Entergy 2010 Annual Report Download - page 61
Download and view the complete annual report
Please find page 61 of the 2010 Entergy annual report below. You can navigate through the pages in the report by either clicking on the pages listed below, or by using the keyword search tool below to find specific information within the annual report.-
 1
1 -
2
-
3
-
4
-
5
-
6
-
7
-
8
-
9
-
10
-
11
-
12
-
13
-
14
-
15
-
16
-
17
-
18
-
19
-
20
-
21
-
22
-
23
-
24
-
25
-
26
-
27
-
28
-
29
-
30
-
31
-
32
-
33
-
34
-
35
-
36
-
37
-
38
-
39
-
40
-
41
-
42
-
43
-
44
-
45
-
46
-
47
-
48
-
49
-
50
-
 51
51 -
 52
52 -
 53
53 -
 54
54 -
 55
55 -
 56
56 -
 57
57 -
 58
58 -
 59
59 -
 60
60 -
 61
61 -
 62
62 -
 63
63 -
 64
64 -
 65
65 -
 66
66 -
 67
67 -
 68
68 -
 69
69 -
 70
70 -
 71
71 -
72
-
73
-
74
-
75
-
76
-
77
-
78
-
79
-
80
-
81
-
82
-
83
-
84
-
85
-
86
-
87
-
88
-
89
-
90
-
91
-
92
-
93
-
94
-
95
-
96
-
97
-
98
-
99
-
100
-
101
-
102
-
103
-
104
-
105
-
106
-
107
-
108
-
109
-
110
-
111
-
112
-
113
-
114
-
115
-
116
 |
 |

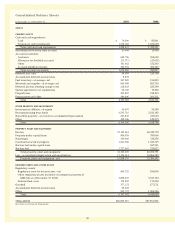
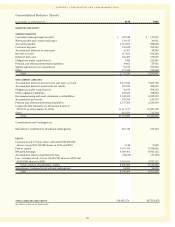
ENTERGY CORPORATION AND SUBSIDIARIES 2010
Consolidated Balance Sheets
In thousands, as of December 31, 2010 2009
LIABILITIES AND EQUITY
CURRENT LIABILITIES
Currently maturing long-term debt $ 299,548 $ 711,957
Notes payable and commercial paper 154,135 30,031
Accounts payable 1,181,099 998,228
Customer deposits 335,058 323,342
Accumulated deferred income taxes 49,307 48,584
Interest accrued 217,685 192,283
Deferred fuel costs 166,409 219,639
Obligations under capital leases 3,388 212,496
Pension and other postretirement liabilities 39,862 55,031
System agreement cost equalization 52,160 187,204
Other 277,598 215,202
Total 2,776,249 3,193,997
NON-CURRENT LIABILITIES
Accumulated deferred income taxes and taxes accrued 8,573,646 7,662,798
Accumulated deferred investment tax credits 292,330 308,395
Obligations under capital leases 42,078 354,233
Other regulatory liabilities 539,026 378,862
Decommissioning and asset retirement cost liabilities 3,148,479 2,939,539
Accumulated provisions 395,250 141,315
Pension and other postretirement liabilities 2,175,364 2,241,039
Long-term debt (includes securitization bonds of
$931,131 as of December 31, 2010) 11,317,157 10,705,738
Other 618,559 711,334
Total 27,101,889 25,443,253
Commitments and Contingencies
Subsidiaries’ preferred stock without sinking fund 216,738 217,343
EQUITY
Common stock, $.01 par value, authorized 500,000,000
shares; issued 254,752,788 shares in 2010 and 2009 2,548 2,548
Paid-in capital 5,367,474 5,370,042
Retained earnings 8,689,401 8,043,122
Accumulated other comprehensive loss (38,212) (75,185)
Less - treasury stock, at cost (76,006,920 shares in 2010 and
65,634,580 shares in 2009) 5,524,811 4,727,167
Total common shareholders’ equity 8,496,400 8,613,360
Subsidiaries’ preferred stock without sinking fund 94,000 94,000
Total 8,590,400 8,707,360
TOTAL LIABILITIES AND EQUITY $38,685,276 $37,561,953
See Notes to Financial Statements.
59