Entergy 2010 Annual Report Download - page 109
Download and view the complete annual report
Please find page 109 of the 2010 Entergy annual report below. You can navigate through the pages in the report by either clicking on the pages listed below, or by using the keyword search tool below to find specific information within the annual report.-
 1
1 -
2
-
3
-
4
-
5
-
6
-
7
-
8
-
9
-
10
-
11
-
12
-
13
-
14
-
15
-
16
-
17
-
18
-
19
-
20
-
21
-
22
-
23
-
24
-
25
-
26
-
27
-
28
-
29
-
30
-
31
-
32
-
33
-
34
-
35
-
36
-
37
-
38
-
39
-
40
-
41
-
42
-
43
-
44
-
45
-
46
-
47
-
48
-
49
-
50
-
51
-
52
-
53
-
54
-
55
-
56
-
57
-
58
-
59
-
60
-
61
-
62
-
63
-
64
-
65
-
66
-
67
-
68
-
69
-
70
-
71
-
72
-
73
-
74
-
75
-
76
-
77
-
78
-
79
-
80
-
81
-
82
-
83
-
84
-
85
-
86
-
87
-
88
-
89
-
90
-
91
-
92
-
93
-
94
-
95
-
96
-
97
-
98
-
 99
99 -
 100
100 -
 101
101 -
 102
102 -
 103
103 -
 104
104 -
 105
105 -
 106
106 -
 107
107 -
 108
108 -
 109
109 -
 110
110 -
 111
111 -
 112
112 -
 113
113 -
 114
114 -
 115
115 -
 116
116
 |
 |

ENTERGY CORPORATION AND SUBSIDIARIES 2010
Notes to Consolidated Financial Statements continued
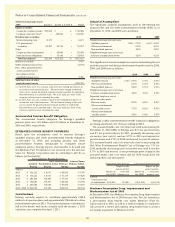
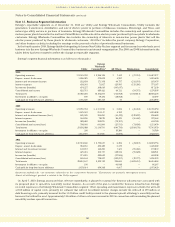
The following table sets forth a reconciliation of changes in the
net assets (liabilities) for the fair value of derivatives classified as
Level 3 in the fair value hierarchy for the years ended December
31, 2010, 2009, and 2008 (in millions):
2010 2009 2008
Balance as of January 1, $ 200 $ 207 $ (12)
Price changes (unrealized gains/losses) 221 310 226
Originated (4) 5 (70)
Settlements (220) (322) 63
Balance as of December 31, $197 $200 $207
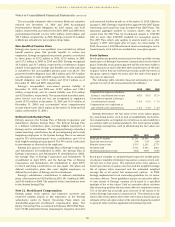
Note 17. Decommissioning Trust Funds
Entergy holds debt and equity securities, classified as available-
for-sale, in nuclear decommissioning trust accounts. The NRC
requires Entergy subsidiaries to maintain trusts to fund the costs
of decommissioning ANO 1, ANO 2, River Bend, Waterford 3,
Grand Gulf, Pilgrim, Indian Point 1 and 2, Vermont Yankee, and
Palisades (NYPA currently retains the decommissioning trusts
and liabilities for Indian Point 3 and FitzPatrick). The funds are
invested primarily in equity securities; fixed-rate, fixed-income
securities; and cash and cash equivalents.
Entergy records decommissioning trust funds on the balance
sheet at their fair value. Because of the ability of the Registrant
Subsidiaries to recover decommissioning costs in rates and in
accordance with the regulatory treatment for decommissioning
trust funds, the Registrant Subsidiaries have recorded an offsetting
amount of unrealized gains/(losses) on investment securities in
other regulatory liabilities/assets. For the nonregulated portion
of River Bend, Entergy Gulf States Louisiana has recorded an
offsetting amount of unrealized gains/(losses) in other deferred
credits. Decommissioning trust funds for Pilgrim, Indian Point
2, Vermont Yankee, and Palisades do not meet the criteria for
regulatory accounting treatment. Accordingly, unrealized gains
recorded on the assets in these trust funds are recognized in
the accumulated other comprehensive income component of
shareholders’ equity because these assets are classified as
available for sale. Unrealized losses (where cost exceeds fair
market value) on the assets in these trust funds are also recorded
in the accumulated other comprehensive income component of
shareholders’ equity unless the unrealized loss is other than
temporary and therefore recorded in earnings. Generally, Entergy
records realized gains and losses on its debt and equity securities
using the specific identification method to determine the cost
basis of its securities.
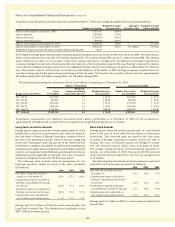
The securities held as of December 31, 2010 and 2009 are
summarized as follows (in millions):
Total Total
Fair Unrealized Unrealized
Value Gains Losses
2010
Equity securities $ 2,076 $ 436 $ 9
Debt securities 1,520 67 12
Total $3,596 $503 $ 21
2009
Equity securities $ 1,788 $ 311 $ 30
Debt securities 1,423 63 8
Total $3,211 $374 $ 38
Deferred taxes on unrealized gains/(losses) are recorded in other
comprehensive income for the decommissioning trusts which
do not meet the criteria for regulatory accounting treatment as
described above. Unrealized gains/(losses) above are reported
before deferred taxes of $130 million and $66 million as of
December 31, 2010 and 2009, respectively. The amortized cost
of debt securities was $1,475 million as of December 31, 2010
and $1,368 million as of December 31, 2009. As of December
31, 2010, the debt securities have an average coupon rate of
approximately 4.34%, an average duration of approximately 5.21
years, and an average maturity of approximately 8.82 years. The
equity securities are generally held in funds that are designed to
approximate or somewhat exceed the return of the Standard &
Poor’s 500 Index. A relatively small percentage of the securities
are held in funds intended to replicate the return of the Wilshire
4500 Index or the Russell 3000 Index.
The fair value and gross unrealized losses of available-for-sale
equity and debt securities, summarized by investment type and
length of time that the securities have been in a continuous loss
position, are as follows as of December 31, 2010 (in millions):
Equity Securities Debt Securities
Gross Gross
Fair Unrealized Fair Unrealized
Value Losses Value Losses
Less than 12 months $ 15 $1 $ 474 $ 11
More than 12 months 105 8 4 1
Total $120 $9 $478 $12
The fair value and gross unrealized losses of available-for-sale
equity and debt securities, summarized by investment type and
length of time that the securities have been in a continuous loss
position, are as follows as of December 31, 2009 (in millions):
Equity Securities Debt Securities
Gross Gross
Fair Unrealized Fair Unrealized
Value Losses Value Losses
Less than 12 months $ 57 $ 1 $311 $ 6
More than 12 months 205 29 18 2
Total $262 $30 $329 $ 8
The unrealized losses in excess of twelve months on equity
securities above relate to Entergy’s Utility operating companies
and System Energy.
The fair value of debt securities, summarized by contractual
maturities, as of December 31, 2010 and 2009 are as follows
(in millions):
2010 2009
Less than 1 year $ 37 $ 31
1 year - 5 years 557 676
5 years - 10 years 512 388
10 years - 15 years 163 131
15 years - 20 years 47 34
20 years+ 204 163
Total $1,520 $1,423
107