Entergy 2010 Annual Report Download - page 100
Download and view the complete annual report
Please find page 100 of the 2010 Entergy annual report below. You can navigate through the pages in the report by either clicking on the pages listed below, or by using the keyword search tool below to find specific information within the annual report.-
 1
1 -
2
-
3
-
4
-
5
-
6
-
7
-
8
-
9
-
10
-
11
-
12
-
13
-
14
-
15
-
16
-
17
-
18
-
19
-
20
-
21
-
22
-
23
-
24
-
25
-
26
-
27
-
28
-
29
-
30
-
31
-
32
-
33
-
34
-
35
-
36
-
37
-
38
-
39
-
40
-
41
-
42
-
43
-
44
-
45
-
46
-
47
-
48
-
49
-
50
-
51
-
52
-
53
-
54
-
55
-
56
-
57
-
58
-
59
-
60
-
61
-
62
-
63
-
64
-
65
-
66
-
67
-
68
-
69
-
70
-
71
-
72
-
73
-
74
-
75
-
76
-
77
-
78
-
79
-
80
-
81
-
82
-
83
-
84
-
85
-
86
-
87
-
88
-
89
-
 90
90 -
 91
91 -
 92
92 -
 93
93 -
 94
94 -
 95
95 -
 96
96 -
 97
97 -
 98
98 -
 99
99 -
 100
100 -
 101
101 -
 102
102 -
 103
103 -
 104
104 -
 105
105 -
 106
106 -
 107
107 -
 108
108 -
 109
109 -
 110
110 -
111
-
112
-
113
-
114
-
115
-
116
 |
 |

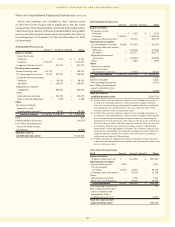
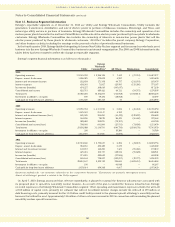
Other Postretirement Trusts
2009 Level 1 Level 2 Level 3 Total
Equity securities:
Corporate common stocks $50,698 $ – $– $ 50,698
Common collective trust(b) – 140,096 – 140,096
Fixed income securities:
Interest-bearing cash 6,115 – – 6,115
U.S. government
securities 25,487 50,714 – 76,201
Other:
Corporate debt instruments – 35,099 – 35,099
State and local obligations – 53,443 – 53,443
Total investments $82,300 $279,352 $– $361,652
Interest receivable 1,567
Other pending transactions (3,156)
Plus: Other postretirement
assets included in the
investments of the
qualified pension trust 2,336
Total fair value of other
postretirement assets $362,399
(a) In 2010, there were two common collective trusts holding investments in
accordance with stated objectives. The investment strategy of the both
trusts was to capture the growth potential of equity markets by replicating
the performance of a specified index. Net asset value per share of the
common collective trusts estimated fair value.
(b) In 2009, there was one common collective trust holding investments in
accordance with stated objectives. The investment strategy of this trust
was to capture the growth potential of equity markets by replicating
the performance of a specified index. Net asset value per share of the
common collective trusts estimated fair value.
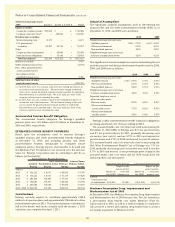
Accumulated Pension Benefit Obligation
The accumulated benefit obligation for Entergy’s qualified
pension plans was $3.8 billion and $3.4 billion at December 31,
2010 and 2009, respectively.
ESTIMATED FUTURE BENEFIT PAYMENTS
Based upon the assumptions used to measure Entergy’s
qualified pension and other postretirement benefit obligation
at December 31, 2010, and including pension and other
postretirement benefits attributable to estimated future
employee service, Entergy expects that benefits to be paid and
the Medicare Part D subsidies to be received over the next ten
years for Entergy Corporation and its subsidiaries will be as
follows (in thousands):
Estimated Future Benefits Payments
Other Postretirement Estimated Future
Qualified Non-Qualified (before Medicare Medicare Subsidy
Pension Pension Subsidy) Receipts
Year(s)
2011 $ 163,212 $ 9,637 $ 68,816 $ 5,991
2012 $ 172,221 $ 8,716 $ 73,119 $ 6,829
2013 $ 183,364 $16,334 $ 77,715 $ 7,736
2014 $ 196,083 $13,451 $ 82,540 $ 8,694
2015 $ 210,586 $13,549 $ 87,629 $ 9,691
2016 - 2020 $1,342,629 $77,109 $523,912 $65,454
Contributions
Entergy currently expects to contribute approximately $368.8
million to its pension plans and approximately $78 million to other
postretirement plans in 2011. The required pension contributions
will not be known with more certainty until the January 1, 2011
valuations are completed by April 1, 2011.
Actuarial Assumptions
The significant actuarial assumptions used in determining the
pension PBO and the other postretirement benefit APBO as of
December 31, 2010, and 2009 were as follows:
2010 2009
Weighted-average discount rate:
Qualified pension 5.60% - 5.70% 6.10% - 6.30%
Other postretirement 5.50% 6.10%
Non-qualified pension 4.90% 5.40%
Weighted-average rate of increase
in future compensation levels 4.23% 4.23%
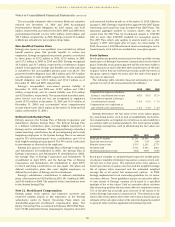
The significant actuarial assumptions used in determining the net
periodic pension and other postretirement benefit costs for 2010,
2009, and 2008 were as follows:
2010 2009 2008
Weighted-average discount rate:
Qualified pension 6.10% - 6.30% 6.75% 6.50%
Other postretirement 6.10% 6.70% 6.50%
Non-qualified pension 5.40% 6.75% 6.50%
Weighted-average rate of increase
in future compensation levels 4.23% 4.23% 4.23%
Expected long-term rate of
return on plan assets:
Pension assets 8.50% 8.50% 8.50%
Other postretirement
non-taxable assets 7.75% 8.50% 8.50%
Other postretirement
taxable assets 5.50% 6.00% 5.50%
Entergy’s other postretirement benefit transition obligations
are being amortized over 20 years ending in 2012.
The assumed health care cost trend rate used in measuring the
December 31, 2010 APBO of Entergy was 8.5% for pre-65 retirees
and 8% for post-65 retirees for 2011, gradually decreasing each
successive year until it reaches 4.75% in 2019 and beyond for
pre-65 retirees and 4.75% in 2018 and beyond for post-65 retirees.
The assumed health care cost trend rate used in measuring the
Net Other Postretirement Benefit Cost of Entergy was 7.5% for
2010, gradually decreasing each successive year until it reaches
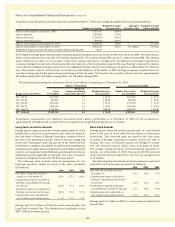
4.75% in 2016 and beyond. A one percentage point change in the
assumed health care cost trend rate for 2010 would have the
following effects (in thousands):
1 Percentage Point Increase 1 Percentage Point Decrease
Impact on the Impact on the
sum of service sum of service
Impact on costs and Impact on costs and
the APBO interest cost the APBO interest cost
Entergy
Corporation and
its subsidiaries $136,203 $13,833 $(121,015) $(11,914)
Medicare Prescription Drug, Improvement and
Modernization Act of 2003
In December 2003, the Medicare Prescription Drug, Improvement
and Modernization Act of 2003 became law. The Act introduces
a prescription drug benefit cost under Medicare (Part D),
which started in 2006, as well as a federal subsidy to employers
who provide a retiree prescription drug benefit that is at least
actuarially equivalent to Medicare Part D.
Notes to Consolidated Financial Statements continued
98