Entergy 2010 Annual Report Download - page 35
Download and view the complete annual report
Please find page 35 of the 2010 Entergy annual report below. You can navigate through the pages in the report by either clicking on the pages listed below, or by using the keyword search tool below to find specific information within the annual report.-
 1
1 -
2
-
3
-
4
-
5
-
6
-
7
-
8
-
9
-
10
-
11
-
12
-
13
-
14
-
15
-
16
-
17
-
18
-
19
-
20
-
21
-
22
-
23
-
24
-
 25
25 -
 26
26 -
 27
27 -
 28
28 -
 29
29 -
 30
30 -
 31
31 -
 32
32 -
 33
33 -
 34
34 -
 35
35 -
 36
36 -
 37
37 -
 38
38 -
 39
39 -
 40
40 -
 41
41 -
 42
42 -
 43
43 -
 44
44 -
 45
45 -
46
-
47
-
48
-
49
-
50
-
51
-
52
-
53
-
54
-
55
-
56
-
57
-
58
-
59
-
60
-
61
-
62
-
63
-
64
-
65
-
66
-
67
-
68
-
69
-
70
-
71
-
72
-
73
-
74
-
75
-
76
-
77
-
78
-
79
-
80
-
81
-
82
-
83
-
84
-
85
-
86
-
87
-
88
-
89
-
90
-
91
-
92
-
93
-
94
-
95
-
96
-
97
-
98
-
99
-
100
-
101
-
102
-
103
-
104
-
105
-
106
-
107
-
108
-
109
-
110
-
111
-
112
-
113
-
114
-
115
-
116
 |
 |

ENTERGY CORPORATION AND SUBSIDIARIES 2010
in the second and third quarters 2010 compared to 2009. The
industrial sector reflected strong sales growth on continuing
signs of economic recovery. The improvement in this sector was
primarily driven by inventory restocking and strong exports with
the chemicals, refining, and miscellaneous manufacturing sectors
leading the improvement.
The retail electric price variance is primarily due to:
n increases in the formula rate plan riders at Entergy Gulf
States Louisiana effective November 2009, January 2010, and
September 2010, at Entergy Louisiana effective November
2009, and at Entergy Mississippi effective July 2009;
n a base rate increase at Entergy Arkansas effective July 2010;
n rate actions at Entergy Texas, including a base rate increase
effective in May and August 2010;
n a formula rate plan provision of $16.6 million recorded in the
third quarter 2009 for refunds that were made to customers in
accordance with settlements approved by the LPSC; and
n the recovery in 2009 by Entergy Arkansas of 2008
extraordinary storm costs, as approved by the APSC, which
ceased in January 2010. The recovery of storm costs is offset
in other operation and maintenance expenses.
See Note 2 to the financial statements for further discussion of
the proceedings referred to above.
The provision for regulatory proceedings variance is primarily
due to provisions recorded in 2009 at Entergy Arkansas. See
Note 2 to the financial statements for a discussion of regulatory
proceedings affecting Entergy Arkansas.
The rough production cost equalization variance is due to an
additional $18.6 million allocation recorded in the second quarter
of 2009 or 2007 rough production cost equalization receipts
ordered by the PUCT to Texas retail customers over what was
originally allocated to Entergy Texas prior to the jurisdictional
separation of Entergy Gulf States, Inc. into Entergy Gulf States
Louisiana and Entergy Texas, effective December 2007, as
discussed in Note 2 to the financial statements.
The ANO decommissioning trust variance is primarily
related to the deferral of investment gains from the ANO 1 and
2 decommissioning trust. The gains resulted in an increase in
interest and investment income and a corresponding increase in
regulatory charges with no effect on net income in accordance
with regulatory treatment.
The fuel recovery variance resulted primarily from an
adjustment to deferred fuel costs in the fourth quarter 2009
relating to unrecovered nuclear fuel costs incurred since January
2008 that will now be recovered after a revision to the fuel
adjustment clause methodology.
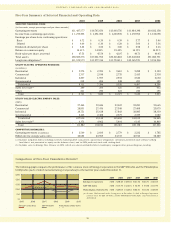
Entergy Wholesale Commodities
Following is an analysis of the change in net revenue comparing
2010 to 2009 (in millions):
2009 Net Revenue $2,364
Nuclear realized price changes (96)
Nuclear volume (60)
Other (8)
2010 Net Revenue $2,200
As shown in the table above, net revenue for Entergy Wholesale
Commodities decreased by $164 million, or 7%, in 2010 compared
to 2009 primarily due to results from its nuclear operations.
The net revenue decrease was primarily due to lower pricing
in its contracts to sell nuclear power and lower nuclear volume
resulting from more planned and unplanned outage days in
2010. Included in net revenue is $46 million and $53 million of
amortization of the Palisades purchased power agreement in
2010 and 2009, respectively, which is non-cash revenue and is
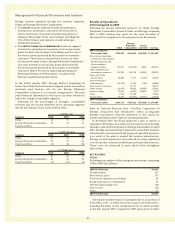
discussed in Note 15 to the financial statements. Following are
key performance measures for Entergy Wholesale Commodities’
nuclear plants for 2010 and 2009:
2010 2009
Net MW in operation at December 31 4,998 4,998
Average realized revenue per MWh $59.16 $61.07
GWh billed 39,655 40,981
Capacity factor 90% 93%
Refueling outage days:
FitzPatrick 35 –
Indian Point 2 33 –
Indian Point 3 – 36
Palisades 26 41
Pilgrim – 31
Vermont Yankee 29 –
Overall, including its non-nuclear plants, Entergy Wholesale
Commodities billed 42,682 GWh in 2010 and 43,969 GWh in 2009,
with average realized revenue per MWh of $59.04 in 2010 and
$60.46 in 2009.
Entergy Wholesale Commodities estimates that it will have a
total of approximately 90 nuclear refueling outage days resulting
from three planned outages in 2011.
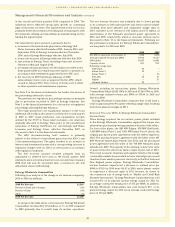
Realized Price per MWh for Entergy Wholesale Commodities
Nuclear Plants
When Entergy acquired the six nuclear power plants included
in the Entergy Wholesale Commodities segment the buyers also
entered into purchased power agreements with each of the sellers.
For four of the plants, the 688 MW Pilgrim, 838 MW FitzPatrick,
1,028 MW Indian Point 2, and 1,041 MW Indian Point 3 plants, the
original purchased power agreements with the sellers expired in
2004. The purchased power agreement with the seller of the 605
MW Vermont Yankee plant extends into 2012, and the purchased
power agreement with the seller of the 798 MW Palisades plant
extends into 2022. The majority of the existing contracts for sales
of power from the other four plants expire by the end of 2012.
The recent economic downturn and negative trends in the energy
commodity markets have resulted in lower natural gas prices and
therefore lower market prices for electricity in the New York and
New England power regions. Entergy Wholesale Commodities’
nuclear business experienced a decrease in realized price per
MWh to $59.16 in 2010 from $61.07 in 2009, and is almost certain
to experience a decrease again in 2011 because, as shown in
the contracted sale of energy table in “Market and Credit Risk
Sensitive Instruments,” Entergy Wholesale Commodities has sold
forward 96% of its planned nuclear energy output for 2011 for
an average contracted energy price of $53 per MWh. In addition,
Entergy Wholesale Commodities has sold forward 87% of its
planned energy output for 2012 for an average contracted energy
price of $49 per MWh.
Management’s Financial Discussion and Analysis continued
33