Entergy 2010 Annual Report Download - page 50
Download and view the complete annual report
Please find page 50 of the 2010 Entergy annual report below. You can navigate through the pages in the report by either clicking on the pages listed below, or by using the keyword search tool below to find specific information within the annual report.-
 1
1 -
2
-
3
-
4
-
5
-
6
-
7
-
8
-
9
-
10
-
11
-
12
-
13
-
14
-
15
-
16
-
17
-
18
-
19
-
20
-
21
-
22
-
23
-
24
-
25
-
26
-
27
-
28
-
29
-
30
-
31
-
32
-
33
-
34
-
35
-
36
-
37
-
38
-
39
-
 40
40 -
 41
41 -
 42
42 -
 43
43 -
 44
44 -
 45
45 -
 46
46 -
 47
47 -
 48
48 -
 49
49 -
 50
50 -
 51
51 -
 52
52 -
 53
53 -
 54
54 -
 55
55 -
 56
56 -
 57
57 -
 58
58 -
 59
59 -
 60
60 -
61
-
62
-
63
-
64
-
65
-
66
-
67
-
68
-
69
-
70
-
71
-
72
-
73
-
74
-
75
-
76
-
77
-
78
-
79
-
80
-
81
-
82
-
83
-
84
-
85
-
86
-
87
-
88
-
89
-
90
-
91
-
92
-
93
-
94
-
95
-
96
-
97
-
98
-
99
-
100
-
101
-
102
-
103
-
104
-
105
-
106
-
107
-
108
-
109
-
110
-
111
-
112
-
113
-
114
-
115
-
116
 |
 |

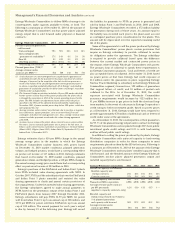
Management’s Financial Discussion and Analysis continued
Entergy Wholesale Commodities to deliver MWh of energy to its
counterparties, make capacity available to them, or both. The
following is a summary as of December 31, 2010 of the amount of
Entergy Wholesale Commodities’ nuclear power plants’ planned
energy output that is sold forward under physical or financial
contracts:
Entergy Wholesale Commodities 2011 2012 2013 2014 2015
Percent of planned generation
sold forward:
Unit-contingent 79% 59% 34% 14% 12%
Unit-contingent with
guarantee of availability(1) 17% 14% 6% 3% 3%
Firm LD 3% 24% 0% 8% 0%
Offsetting positions (3%) (10%) 0% 0% 0%
Total energy sold forward 96% 87% 40% 25% 15%
Planned generation (TWh)(4) 41 41 40 41 41
Average revenue under
contract per MWh(2)(3) $53 $49 $47 $51 $51
(1) A sale of power on a unit-contingent basis coupled with a guarantee of
availability provides for the payment to the power purchaser of contract
damages, if incurred, in the event the seller fails to deliver power as a
result of the failure of the specified generation unit to generate power at
or above a specified availability threshold. All of Entergy’s outstanding
guarantees of availability provide for dollar limits on Entergy’s maximum
liability under such guarantees.
(2) The Vermont Yankee acquisition included a 10-year PPA under which the
former owners will buy most of the power produced by the plant, which
is through the expiration in 2012 of the current operating license for the
plant. The PPA includes an adjustment clause under which the prices
specified in the PPA will be adjusted downward monthly, beginning in
November 2005, if power market prices drop below PPA prices, which has
not happened thus far.
(3) Average revenue under contract may fluctuate due to positive or negative
basis differences, option premiums, costs to convert firm LD to unit-
contingent, and other risk management costs. Also, average revenue under
contract excludes payments owed under the value sharing agreement
with NYPA.
(4) Assumes license renewal for plants whose current licenses expire within
five years. License renewal applications are in process for four units, as
follows (with current license expirations in parentheses): Vermont Yankee
(March 2012), Pilgrim (June 2012), Indian Point 2 (September 2013), and
Indian Point 3 (December 2015).
Entergy estimates that a $10 per MWh change in the annual
average energy price in the markets in which the Entergy
Wholesale Commodities nuclear business sells power, based
on December 31, 2010 market conditions, planned generation
volume, and hedged position, would have a corresponding effect
on pre-tax net income of $17 million in 2011. Entergy estimates
that, based on December 31, 2009 market conditions, planned
generation volume, and hedged position, a $10 per MWh change in
the annual average energy price would have had a corresponding
effect on pre-tax net income of $53 million in 2010.
Entergy’s purchase of the FitzPatrick and Indian Point 3 plants
from NYPA included value sharing agreements with NYPA. In
October 2007, NYPA and the subsidiaries that own the FitzPatrick
and Indian Point 3 plants amended and restated the value
sharing agreements to clarify and amend certain provisions of
the original terms. Under the amended value sharing agreements,
the Entergy subsidiaries agreed to make annual payments to
NYPA based on the generation output of the Indian Point 3 and
FitzPatrick plants from January 2007 through December 2014.
Entergy subsidiaries will pay NYPA $6.59 per MWh for power
sold from Indian Point 3, up to an annual cap of $48 million, and
$3.91 per MWh for power sold from FitzPatrick, up to an annual
cap of $24 million. The annual payment for each year’s output
is due by January 15 of the following year. Entergy will record
the liability for payments to NYPA as power is generated and
sold by Indian Point 3 and FitzPatrick. In 2010, 2009, and 2008,
Entergy Wholesale Commodities recorded a $72 million liability
for generation during each of those years. An amount equal to
the liability was recorded each year to the plant asset account
as contingent purchase price consideration for the plants. This
amount will be depreciated over the expected remaining useful
life of the plants.
Some of the agreements to sell the power produced by Entergy
Wholesale Commodities’ power plants contain provisions that
require an Entergy subsidiary to provide collateral to secure
its obligations under the agreements. The Entergy subsidiary
is required to provide collateral based upon the difference
between the current market and contracted power prices in
the regions where Entergy Wholesale Commodities sells power.
The primary form of collateral to satisfy these requirements is
an Entergy Corporation guaranty. Cash and letters of credit are
also acceptable forms of collateral. At December 31, 2010, based
on power prices at that time, Entergy had credit exposure of
$14 million under the guarantees in place supporting Entergy
Nuclear Power Marketing (a subsidiary in the Entergy Wholesale
Commodities segment) transactions, $20 million of guarantees
that support letters of credit, and $5 million of posted cash
collateral to the ISOs. As of December 31, 2010, the credit
exposure associated with Entergy Wholesale Commodities
assurance requirements would increase by $123 million for a
$1 per MMBtu increase in gas prices in both the short-and long-
term markets. In the event of a decrease in Entergy Corporation’s
credit rating to below investment grade, based on power prices
as of December 31, 2010, Entergy would have been required to
provide approximately $78 million of additional cash or letters of
credit under some of the agreements.
As of December 31, 2010, the counterparties or their guarantors
for 99.7% of the planned energy output under contract for Entergy
Wholesale Commodities nuclear plants through 2015 have public
investment grade credit ratings and 0.3% is with load-serving
entities without public credit ratings.
In addition to selling the power produced by its plants, Entergy
Wholesale Commodities sells unforced capacity to load-serving
distribution companies in order for those companies to meet
requirements placed on them by the ISO in their area. Following is
a summary as of December 31, 2010 of the amount of the Entergy
Wholesale Commodities nuclear plants’ installed capacity that is
sold forward, and the blended amount of the Entergy Wholesale
Commodities nuclear plants’ planned generation output and
installed capacity that is sold forward:
Entergy Wholesale Commodities 2011 2012 2013 2014 2015
Percent of capacity sold forward:
Bundled capacity and
energy contracts 25% 18% 16% 16% 16%
Capacity contracts 37% 29% 26% 10% 0%
Total capacity sold forward 62% 47% 42% 26% 16%
Planned net MW in operation 4,998 4,998 4,998 4,998 4,998
Average revenue under contract
per kW per month $2.6 $3.0 $3.1 $3.5 $ –
(applies to capacity contracts only)
Blended capacity and
energy recap (based on revenues)
% of planned generation
and capacity sold forward 96% 87% 40% 26% 15%
Average revenue under
contract per MWh $54 $51 $50 $53 $52
48