Dollar Tree 2004 Annual Report Download - page 49
Download and view the complete annual report
Please find page 49 of the 2004 Dollar Tree annual report below. You can navigate through the pages in the report by either clicking on the pages listed below, or by using the keyword search tool below to find specific information within the annual report.-
 1
1 -
2
-
3
-
4
-
5
-
6
-
7
-
8
-
9
-
10
-
11
-
12
-
13
-
14
-
15
-
16
-
17
-
18
-
19
-
20
-
21
-
22
-
23
-
24
-
25
-
26
-
27
-
28
-
29
-
30
-
31
-
32
-
33
-
34
-
35
-
36
-
37
-
38
-
 39
39 -
 40
40 -
 41
41 -
 42
42 -
 43
43 -
 44
44 -
 45
45 -
 46
46 -
 47
47 -
 48
48 -
 49
49 -
 50
50 -
 51
51 -
 52
52 -
 53
53 -
 54
54
 |
 |

DOLLAR TREE STORES, INC. • 2004 ANNUAL REPORT 45
The 2003 Non-Employee Director Stock Option
Plan provides non-qualified stock options to non-
employee members of the Company’s Board of Directors.
The stock options are functionally equivalent to such
options issued under the EIP discussed above. The
exercise price of each stock option granted equals the
market price of the Company’s stock at the date of grant.
The options generally vest immediately.
The 2003 Director Deferred Compensation Plan
permits any of the Company’s directors who receive a
retainer or other fees for Board or committee service to
defer all or a portion of such fees until a future date, at
which time they may be paid in cash or shares of the
Company’s common stock, or to receive all or a portion
of such fees in non-statutory stock options. Deferred fees
that are paid out in cash will earn interest at the 30-year
Treasury Bond Rate. If a director elects to be paid in
common stock, the number of shares will be determined
by dividing the deferred fee amount by the current
market price of a share of the Company’s common
stock. The number of options issued to a director will
equal the deferred fee amount divided by 33% of the
price of a share of the Company’s common stock. The
exercise price will equal the fair market value of the
Company’s common stock at the date the option was
issued. The options are fully vested when issued and
have a term of 10 years.
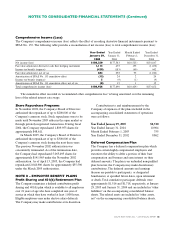
The fair value of each option grant is estimated on
the date of grant using the Black-Scholes option-pricing
model with the following weighted average assumptions:
Fiscal Fiscal Fiscal
2004 2003 2002
Expected term in years 5.3 5.4 5.7
Expected volatility 59.8% 60.7% 63.8%
Annual dividend yield ———
Risk free interest rate 3.7% 3.4% 3.0%
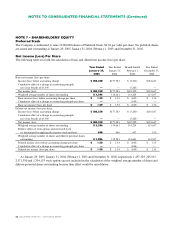
The following tables summarize the Company’s various option plans as of January 29, 2005, January 31, 2004,
February 1, 2003 and December 31, 2002 and for the years ended January 29, 2005 and January 31, 2004, the month
ended February 1, 2003, and the year ended December 31, 2002, and information about fixed options outstanding at
January 29, 2005:
Stock Option Activity
January 29, 2005 January 31, 2004 February 1, 2003 December 31, 2002
Weighted Weighted Weighted Weighted
Average Average Average Average
Per Share Per Share Per Share Per Share
Exercise Exercise Exercise Exercise
Shares Price Shares Price Shares Price Shares Price
Outstanding, beginning of period 6,007,471 $23.81 5,414,023 $24.19 5,440,547 $24.17 5,683,827 $20.39
Granted 1,682,572 25.52 1,904,057 20.54 6,000 25.26 1,723,000 31.54
Exercised (608,432) 19.58 (993,841) 19.57 (12,402) 12.93 (1,632,942) 18.64
Forfeited (534,192) 25.90 (316,768) 24.01 (20,122) 25.89 (333,338) 25.02
Outstanding, end of period 6,547,419 24.47 6,007,471 23.81 5,414,023 24.19 5,440,547 24.17
Options exercisable at end of period 3,282,102 24.52 2,649,188 24.31 2,340,921 21.84 2,343,879 21.77
Weighted average fair value of options
granted during the period $14.27 $17.08 $15.24 $18.66
NOTES TO CONSOLIDATED FINANCIAL STATEMENTS (Continued)