Dollar Tree 2004 Annual Report Download - page 24
Download and view the complete annual report
Please find page 24 of the 2004 Dollar Tree annual report below. You can navigate through the pages in the report by either clicking on the pages listed below, or by using the keyword search tool below to find specific information within the annual report.-
 1
1 -
2
-
3
-
4
-
5
-
6
-
7
-
8
-
9
-
10
-
11
-
12
-
13
-
 14
14 -
 15
15 -
 16
16 -
 17
17 -
 18
18 -
 19
19 -
 20
20 -
 21
21 -
 22
22 -
 23
23 -
 24
24 -
 25
25 -
 26
26 -
 27
27 -
 28
28 -
 29
29 -
 30
30 -
 31
31 -
 32
32 -
 33
33 -
 34
34 -
35
-
36
-
37
-
38
-
39
-
40
-
41
-
42
-
43
-
44
-
45
-
46
-
47
-
48
-
49
-
50
-
51
-
52
-
53
-
54
 |
 |

20 DOLLAR TREE STORES, INC. • 2004 ANNUAL REPORT
programs from internally generated funds and seasonal
borrowings under our credit facilities.
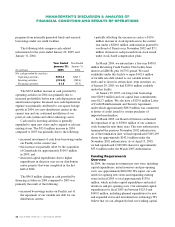
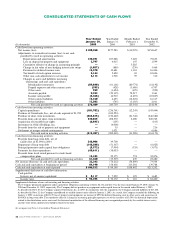
The following table compares cash-related
information for the years ended January 29, 2005, and
January 31, 2004:
Year Ended Year Ended
January 29, January 31,
(In millions) 2005 2004
Net cash provided by (used in):
Operating activities $276.5 $243.7
Investing activities (315.4) (282.4)
Financing activities 61.3 (35.5)
The $32.8 million increase in cash provided by
operating activities in 2004 was primarily due to
increased profitability before non-cash depreciation and
amortization expense. Increased non-cash depreciation
expense was primarily attributed to our square footage
growth in 2004, two new distribution centers in the
current year and our continued installation of our
point-of-sale systems and other technology assets.
Cash used in investing activities is generally
expended to open new stores and to expand or relocate
existing stores. The $33.0 million increase in 2004
compared to 2003 was primarily due to the following:
• increased investment of cash from borrowings under
our Facility in the current year;
• this increase was partially offset by the acquisition
of Greenbacks for approximately $100.5 million
in 2003; and
• decreased capital expenditures due to higher
expenditures in the prior year on our distribution
center projects that were completed in the first
half of 2004.
The $96.8 million change in cash provided by
financing activities in 2004 compared to 2003 was
primarily the result of the following:
• increased borrowings under our Facility, net of
the repayment of our variable rate debt for our
distribution centers;
• partially offsetting this increase in cash is a $10.6
million increase in stock repurchases in the current
year under a $200.0 million authorization granted by
our Board of Directors in November 2002 and $7.1
million decrease in cash proceeds from stock issued
under stock-based compensation plans.
In March 2004, we entered into a five-year $450.0
million Revolving Credit Facility. This facility bears
interest at LIBOR, plus 0.475% spread. We used
availability under this facility to repay $142.6 million
of variable rate debt related to our variable interest
entity and to invest in certain short-term securities. As
of January 29, 2005, we had $200.0 million available
under this facility.
At January 29, 2005, our long-term borrowings
were $269.0 million and our capital lease commitments
were $12.7 million. We also have a $125.0 million Letter
of Credit Reimbursement and Security Agreement,
under which approximately $88.9 million was committed
to letters of credit issued for routine purchases of
imported merchandise.
In March 2005, our Board of Directors authorized
the repurchase of up to $300.0 million of our common
stock during the next three years. This new authorization
terminated the previous November 2002 authorization.
As of the termination date, we had repurchased 5,065,495
shares for approximately $142.0 million under the
November 2002 authorization. As of April 13, 2005,
we had repurchased 2,048,900 shares for approximately
$55.6 million under the March 2005 authorization.
Funding Requirements
Overview
In 2004, the average investment per new store, including
capital expenditures, initial inventory and pre-opening
costs, was approximately $469,000. We expect our cash
needs for opening new stores and expanding existing
stores in fiscal 2005 to total approximately $138.6
million, which includes capital expenditures and initial
inventory and pre-opening costs. Our estimated capital
expenditures for fiscal 2005 are between $125.0 and
$140.0 million, including planned expenditures for new
and expanded stores and investments in technology. We
believe that we can adequately fund our working capital
MANAGEMENT’S DISCUSSION & ANALYSIS OF
FINANCIAL CONDITION AND RESULTS OF OPERATIONS