Dollar Tree 2004 Annual Report Download - page 23
Download and view the complete annual report
Please find page 23 of the 2004 Dollar Tree annual report below. You can navigate through the pages in the report by either clicking on the pages listed below, or by using the keyword search tool below to find specific information within the annual report.-
 1
1 -
2
-
3
-
4
-
5
-
6
-
7
-
8
-
9
-
10
-
11
-
12
-
 13
13 -
 14
14 -
 15
15 -
 16
16 -
 17
17 -
 18
18 -
 19
19 -
 20
20 -
 21
21 -
 22
22 -
 23
23 -
 24
24 -
 25
25 -
 26
26 -
 27
27 -
 28
28 -
 29
29 -
 30
30 -
 31
31 -
 32
32 -
 33
33 -
34
-
35
-
36
-
37
-
38
-
39
-
40
-
41
-
42
-
43
-
44
-
45
-
46
-
47
-
48
-
49
-
50
-
51
-
52
-
53
-
54
 |
 |

DOLLAR TREE STORES, INC. • 2004 ANNUAL REPORT 19
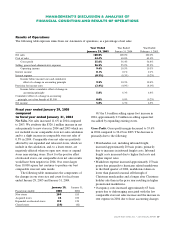
in our larger, newer stores, particularly the stores over
10,000 square feet, have been stronger than those in our
smaller, older stores.
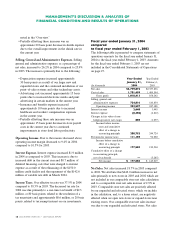
The following table summarizes the components of
the changes in our store size and count for fiscal years
ended January 31, 2004 and February 1, 2003.
January 31, February 1,
Fiscal years ended 2004 2003
New stores 183 314
Acquired stores 100 —
Expanded or relocated stores 124 110
Closed stores (42) (36)
Of the 3.6 million selling square foot increase in
2003, approximately 0.9 million selling square feet was
added by expanding existing stores.
Gross Profit. Gross profit margin was 36.4% in 2003 and
2002. While gross profit margin remained consistent year
to year, the changes in the components of gross margin
are detailed below:
• Markdown expense decreased approximately 20 basis
points due to better seasonal sell-through, use of
point-of-sale data to better manage the buying process
and better allocated merchandise across store classes;
• Offsetting the markdown improvement was a 20
basis point increase in occupancy costs. This increase
was the result of two fewer selling days in 2003
compared to 2002 and increased occupancy rates in
our smaller stores which generally experience lower
comparable store net sales;
• In addition, during 2003, gross profit margin was
affected by approximately $3.8 million of additional
non-cash depreciation expense in cost of sales
associated with the adoption of Financial Accounting
Standards Board Interpretation No. 46, Consolidation
of Variable Interest Entities. By adopting FIN 46, four
of our distribution centers, previously accounted for
as operating leases, were consolidated in our financial
statements effective January 1, 2003.
Selling, General and Administrative Expenses. Selling,
general and administrative expenses, as a percentage of
net sales, remained unchanged at 25.9% in 2003; the
changes in the components of selling, general and
administrative expenses are detailed below:
• Depreciation expense increased approximately 50
basis points due to our larger new and expanded
stores and the continued installation of our new
point-of-sale systems and other technology assets.
• This increase was partially offset by a decrease of
approximately 40 basis points in payroll-related and
store operating expenses. Continued improvements
in store-level labor productivity and store supply
expenses were the primary drivers of our lower
payroll-related and store operating expenses, as a
percentage of net sales.
Operating Income. Due to the reasons discussed above,
operating income margin was consistent at 10.5% for
2003 and 2002.
Interest Income and Expense. Interest income, as a
percentage of net sales, was consistent at 0.1% in
2003 and 2002. Interest expense increased $3.6 million
primarily due to the consolidation of our variable-interest
entity effective January 1, 2003.
Income Taxes. Our effective tax rate was 38.5% in
2003 and 2002.
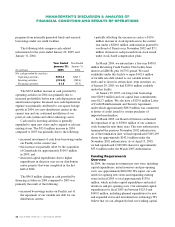
Liquidity and Capital Resources
Our business requires capital to build and open new
stores, expand our distribution network and operate
existing stores. Our working capital requirements for
existing stores are seasonal and usually reach their peak
in September and October. Historically, we have satisfied
our seasonal working capital requirements for existing
stores and have funded our store opening and expansion
MANAGEMENT’S DISCUSSION & ANALYSIS OF
FINANCIAL CONDITION AND RESULTS OF OPERATIONS