Dollar Tree 2004 Annual Report Download - page 22
Download and view the complete annual report
Please find page 22 of the 2004 Dollar Tree annual report below. You can navigate through the pages in the report by either clicking on the pages listed below, or by using the keyword search tool below to find specific information within the annual report.-
 1
1 -
2
-
3
-
4
-
5
-
6
-
7
-
8
-
9
-
10
-
11
-
 12
12 -
 13
13 -
 14
14 -
 15
15 -
 16
16 -
 17
17 -
 18
18 -
 19
19 -
 20
20 -
 21
21 -
 22
22 -
 23
23 -
 24
24 -
 25
25 -
 26
26 -
 27
27 -
 28
28 -
 29
29 -
 30
30 -
 31
31 -
 32
32 -
33
-
34
-
35
-
36
-
37
-
38
-
39
-
40
-
41
-
42
-
43
-
44
-
45
-
46
-
47
-
48
-
49
-
50
-
51
-
52
-
53
-
54
 |
 |

18 DOLLAR TREE STORES, INC. • 2004 ANNUAL REPORT
noted in the “Overview.”
• Partially offsetting these increases was an
approximate 20 basis point decrease in shrink expense
due to the overall improvement in the shrink rate in
the current year.
Selling, General and Administrative Expenses. Selling,
general and administrative expenses, as a percentage of
net sales, increased to 26.2% in 2004 compared to 25.9%
in 2003. The increase is primarily due to the following:
• Depreciation expense increased approximately
30 basis points as a result of our larger new and
expanded stores and the continued installation of our
point-of-sales systems and other technology assets.
• Advertising costs increased approximately 15 basis
points due to increased electronic media and print
advertising in certain markets in the current year.
• Insurance and benefits expense increased
approximately 10 basis points due to increased
healthcare and workers’compensation expenses
in the current year.
• Partially offsetting these rate increases was an
approximate 15 basis point decrease in store payroll
costs in the current year due to continued
improvements in store-level labor productivity.
Operating Income. Due to the reasons discussed above,
operating income margin decreased to 9.4% in 2004
compared to 10.5% for 2003.
Interest Expense. Interest expense increased $1.9 million
in 2004 as compared to 2003. This increase is due to
increased debt in the current year and $0.7 million of
deferred financing costs that were charged to interest
expense as a result of the refinancing of the $150.0
million credit facility and the repayment of the $142.6
million of variable rate debt in March 2004.
Income Taxes. Our effective tax rate was 37.5% in 2004
compared to 38.5% in 2003. The decreased tax rate for
2004 was due primarily to a one-time tax benefit of $2.3
million, or 80 basis points, related to the resolution of a
tax uncertainty and approximately $0.6 million, or 20 basis
points, related to tax exempt interest on our investments.
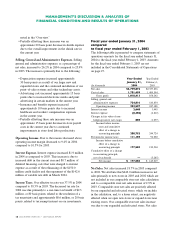
Fiscal year ended January 31, 2004
compared
to fiscal year ended February 1, 2003
The following table is presented to compare statements of
operations amounts for the fiscal year ended January 31,
2004 to the fiscal year ended February 1, 2003. Amounts
for the fiscal year ended February 1, 2003 are not
included in the Consolidated Statements of Operations
on page 27.
Year Ended Year Ended
January 31, February 1,
(In thousands) 2004 2003
Net sales $2,799,872 $2,357,836
Cost of sales 1,781,459 1,499,594
Gross profit 1,018,413 858,242
Selling, general and
administrative expenses 724,816 610,854
Operating income 293,597 247,388
Interest income 2,648 3,445
Interest expense (8,382) (4,812)
Changes in fair value of non-
hedging interest rate swaps 889 (1,297)
Income before income
taxes and cumulative
effect of a change in
accounting principle 288,752 244,724
Provision for income taxes 111,169 94,220
Income before cumulative
effect of a change in
accounting principle 177,583 150,504
Cumulative effect of a change
in accounting principle,
net of tax benefit —(5,285)
Net income $ 177,583 $ 145,219
Net Sales. Net sales increased 18.7% in 2003 compared
to 2002. We attribute this $442.0 million increase in net
sales primarily to new stores in 2003 and 2002 which are
not included in our comparable store net sales calculation
and to a comparable store net sales increase of 2.9% in
2003. Comparable store net sales are positively affected
by our expanded and relocated stores, which we include
in the calculation, and, to a lesser extent, are negatively
affected when we open new stores or expand stores near
existing stores. Our comparable store net sales increase
was due to our expanded and relocated stores. Net sales
MANAGEMENT’S DISCUSSION & ANALYSIS OF
FINANCIAL CONDITION AND RESULTS OF OPERATIONS