Dollar Tree 2004 Annual Report Download - page 46
Download and view the complete annual report
Please find page 46 of the 2004 Dollar Tree annual report below. You can navigate through the pages in the report by either clicking on the pages listed below, or by using the keyword search tool below to find specific information within the annual report.-
 1
1 -
2
-
3
-
4
-
5
-
6
-
7
-
8
-
9
-
10
-
11
-
12
-
13
-
14
-
15
-
16
-
17
-
18
-
19
-
20
-
21
-
22
-
23
-
24
-
25
-
26
-
27
-
28
-
29
-
30
-
31
-
32
-
33
-
34
-
35
-
 36
36 -
 37
37 -
 38
38 -
 39
39 -
 40
40 -
 41
41 -
 42
42 -
 43
43 -
 44
44 -
 45
45 -
 46
46 -
 47
47 -
 48
48 -
 49
49 -
 50
50 -
 51
51 -
 52
52 -
 53
53 -
 54
54
 |
 |

42 DOLLAR TREE STORES, INC. • 2004 ANNUAL REPORT
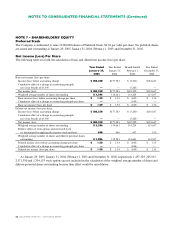
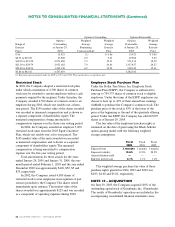
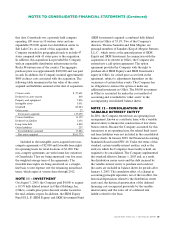
NOTE 7 – SHAREHOLDERS’ EQUITY
Preferred Stock
The Company is authorized to issue 10,000,000 shares of Preferred Stock, $0.01 par value per share. No preferred shares
are issued and outstanding at January 29, 2005, January 31, 2004, February 1, 2003 and December 31, 2002.
Net Income (Loss) Per Share
The following table sets forth the calculation of basic and diluted net income (loss) per share:
Year Ended Year Ended Month Ended Year Ended
January 29, January 31, February 1, December 31,
2005 2004 2003 2002
Basic net income (loss) per share:
Income (loss) before accounting change $ 180,250 $177,583 $ (5,240) $154,647
Cumulative effect of a change in accounting principle,
net of tax benefit of $3,309 —— (5,285) —
Net income (loss) $ 180,250 $177,583 $(10,525) $154,647
Weighted average number of shares outstanding 113,296 114,641 114,224 113,637
Basic income (loss) before accounting change per share $ 1.59 $ 1.55 $ (0.05) $ 1.36
Cumulative effect of a change in accounting principle per share —— (0.04) —
Basic net income (loss) per share $ 1.59 $ 1.55 $ (0.09) $ 1.36
Diluted net income (loss) per share:
Income (loss) before accounting change $ 180,250 $177,583 $ (5,240) $154,647
Cumulative effect of a change in accounting principle,
net of tax benefit of $3,309 —— (5,285) —
Net income (loss) $ 180,250 $177,583 $(10,525) $154,647
Weighted average number of shares outstanding 113,296 114,641 114,224 113,637
Dilutive effect of stock options and restricted stock
(as determined by applying the treasury stock method) 690 940 437 910
Weighted average number of shares and dilutive potential shares
outstanding 113,986 115,581 114,661 114,547
Diluted income (loss) before accounting change per share $ 1.58 $ 1.54 $ (0.05) $ 1.35
Cumulative effect of a change in accounting principle per share —— (0.04) —
Diluted net income (loss) per share $ 1.58 $ 1.54 $ (0.09) $ 1.35
At January 29, 2005, January 31, 2004, February 1, 2003 and December 31, 2002, respectively, 1,457,329, 203,015,
2,171,350 and 1,704,153 stock options are not included in the calculation of the weighted average number of shares and
dilutive potential shares outstanding because their effect would be anti-dilutive.
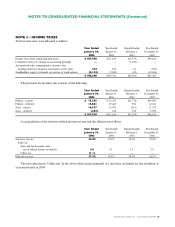
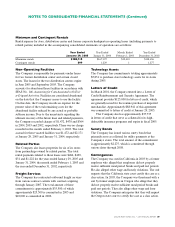
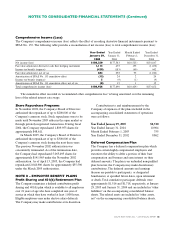
NOTES TO CONSOLIDATED FINANCIAL STATEMENTS (Continued)