Dollar Tree 2004 Annual Report Download - page 33
Download and view the complete annual report
Please find page 33 of the 2004 Dollar Tree annual report below. You can navigate through the pages in the report by either clicking on the pages listed below, or by using the keyword search tool below to find specific information within the annual report.-
 1
1 -
2
-
3
-
4
-
5
-
6
-
7
-
8
-
9
-
10
-
11
-
12
-
13
-
14
-
15
-
16
-
17
-
18
-
19
-
20
-
21
-
22
-
 23
23 -
 24
24 -
 25
25 -
 26
26 -
 27
27 -
 28
28 -
 29
29 -
 30
30 -
 31
31 -
 32
32 -
 33
33 -
 34
34 -
 35
35 -
 36
36 -
 37
37 -
 38
38 -
 39
39 -
 40
40 -
 41
41 -
 42
42 -
 43
43 -
44
-
45
-
46
-
47
-
48
-
49
-
50
-
51
-
52
-
53
-
54
 |
 |

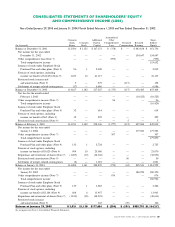
DOLLAR TREE STORES, INC. • 2004 ANNUAL REPORT 29
Accumulated
Common Additional Other Share-
Stock Common Paid-in Comprehensive Unearned Retained holders’
(In thousands) Shares Stock Capital Loss Compensation Earnings Equity
Balance at December 31, 2001 112,506 $ 1,125 $ 167,151 $ (378) $ — $ 483,838 $ 651,736
Net income for the year ended
December 31, 2002 — — — — — 154,647 154,647
Other comprehensive loss (Note 7) — — — (995) — — (995)
Total comprehensive income 153,652
Issuance of stock under Employee Stock
Purchase Plan and other plans (Note 9) 96 1 2,038 — — — 2,039
Exercise of stock options, including
income tax benefit of $10,696 (Note 9) 1,633 16 41,117 — — — 41,133
Restricted stock issuance and
and amortization (Note 9) 9 — 275 — (117) — 158
Settlement of merger-related contingencies (57) — 6,686 — — — 6,686
Balance at December 31, 2002 114,187 1,142 217,267 (1,373) (117) 638,485 855,404
Net loss for the month ended
February 1, 2003 — — — — — (10,525) (10,525)
Other comprehensive income (Note 7) — — — 96 — — 96
Total comprehensive income (10,429)
Issuance of stock under Employee Stock
Purchase Plan and other plans (Note 9) 32 — 614 — — — 614
Exercise of stock options, including
income tax benefit of $65 (Note 9) 12 — 225 — — — 225
Restricted stock amortization (Note 9) — — — — 5 — 5
Balance at February 1, 2003 114,231 1,142 218,106 (1,277) (112) 627,960 845,819
Net income for the year ended
January 31, 2004 — — — — — 177,583 177,583
Other comprehensive income (Note 7) — — — 307 — — 307
Total comprehensive income 177,890
Issuance of stock under Employee Stock
Purchase Plan and other plans (Note 9) 132 1 2,724 — — — 2,725
Exercise of stock options, including
income tax benefit of $5,620 (Note 9) 994 10 25,060 — — — 25,070
Repurchase and retirement of shares (Note 7) (1,265) (12) (38,041) — — — (38,053)
Restricted stock amortization (Note 9) — — — — 50 — 50
Settlement of merger-related contingencies (8) — 1,021 — — — 1,021
Balance at January 31, 2004 114,084 1,141 208,870 (970) (62) 805,543 1,014,522
Net income for the year ended
January 29, 2005 — — — — — 180,250 180,250
Other comprehensive income (Note 7) — — — 676 — — 676
Total comprehensive income 180,926
Issuance of stock under Employee Stock
Purchase Plan and other plans (Note 9) 139 1 3,285 — — — 3,286
Exercise of stock options, including
income tax benefit of $2,144 (Note 9) 608 6 13,957 — — — 13,963
Repurchase and retirement of shares (Note 7) (1,810) (18) (48,593) — — — (48,611)
Restricted stock issuance
and amortization (Note 9) — — 165 — (39) — 126
Balance at January 29, 2005 113,021 $1,130 $177,684 $ (294) $ (101) $985,793 $1,164,212
See accompanying Notes to Consolidated Financial Statements.
CONSOLIDATED STATEMENTS OF SHAREHOLDERS’ EQUITY
AND COMPREHENSIVE INCOME (LOSS)
Years Ended January 29, 2005 and January 31, 2004, Month Ended February 1, 2003 and Year Ended December 31, 2002