Dollar Tree 2004 Annual Report Download - page 19
Download and view the complete annual report
Please find page 19 of the 2004 Dollar Tree annual report below. You can navigate through the pages in the report by either clicking on the pages listed below, or by using the keyword search tool below to find specific information within the annual report.
DOLLAR TREE STORES, INC. • 2004 ANNUAL REPORT 15
Key Events and Recent Developments
Several key events have had or are expected to have a
significant effect on our results of operations. You should
keep in mind that:
• In March 2005, our Board of Directors authorized
the repurchase of up to $300 million of our common
stock during the next three years. This authorization
superseded the previous repurchase program
authorized by the Board in November 2002.
• In 2004, we completed construction and began
operations in two new distribution centers. In June
2004, we began operations in our new distribution
center in Joliet, Illinois. The Joliet distribution center
is a 1.2 million square foot, fully automated facility
that replaced our Chicago distribution center. In
February 2004, we began operations in our Ridgefield,
Washington distribution center. The Ridgefield
distribution center is a 665,000 square foot facility
that can be expanded to accommodate future growth
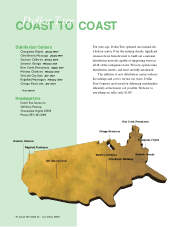
needs. With the completion of these two distribution
centers, we now have nine distribution centers that
will support approximately $4.5 billion in sales
annually. We do not plan to expand our distribution
center capacity until at least fiscal 2006.
• In March 2004, we entered into a five-year $450.0
million Unsecured Revolving Credit Facility
(Facility). We used availability under this Facility to
repay the $142.6 million of variable rate debt related
to our variable interest entity. This Facility also
replaced our $150.0 million revolving credit facility.
• In June 2003, we completed our acquisition of
Greenbacks, Inc., based in Salt Lake City, Utah.
Greenbacks operated 100 stores in 10 western states
and an expandable 252,000 square foot distribution
center in Salt Lake City. We accounted for this
acquisition under the purchase method of accounting
and as a result, Greenbacks is included in our results
since the date of acquisition, which was June 29, 2003.
• In January 2003, we changed our fiscal year from
a calendar year to a retail fiscal year ending on the
Saturday closest to January 31. Our first fiscal
year reported is fiscal 2003. Fiscal 2003 is the
period beginning February 2, 2003 and ending
January 31, 2004.
Overview
Our net sales are derived from the sale of merchandise.
Two major factors tend to affect our net sales trends. First
is our success at opening new stores or adding new stores
through mergers or acquisitions. Second, sales vary at our
existing stores from one year to the next. We refer to this
change as a change in comparable store net sales, because
we compare only those stores that are open throughout
both of the periods being compared. We include sales
from stores expanded during the year in the calculation
of comparable store net sales, which has the effect of
increasing our comparable store net sales. The term
‘expanded’also includes stores that are relocated.
In fiscal 2004, we increased our selling square footage
by approximately 21%. Of this 3.6 million selling square
foot increase, approximately 0.9 million was added by
expanding existing stores. While we met our square
footage growth target in 2004, many of these stores opened
later than planned during the year, resulting in lower
overall sales than planned. Our net comparable store net
sales increase for fiscal 2004 was 0.5%, which was lower
than planned. If not for the positive effect of relocated
stores, our comparable store net sales results would have
been negative. In 2005, we will focus on reengineering our
real estate process, which includes timely opening of new
stores and relocated stores and have therefore planned for
square footage growth of 14%-16%.
Most retailers have the ability to increase their
merchandise prices or alter the mix of their merchandise
to favor higher-priced items in order to increase their
comparable store net sales. As a fixed-price point retailer,
we do not have the ability to raise our prices. Generally,
our comparable store net sales will increase only if we
sell more units per transaction or experience an increase
in transactions.
We expect the substantial majority of our future
net sales growth to come from square footage growth
resulting from new store openings and expansion of
existing stores. We expect the average size of new stores
opened in fiscal 2005 to be approximately 10,000 selling
square feet per store (or about 12,500 gross square feet).
We believe this size allows us to achieve our objectives in
the markets in which we plan to expand. Larger stores
take longer to negotiate, build out and open and generally
have lower net sales per square foot than our smaller stores.
MANAGEMENT’S DISCUSSION & ANALYSIS OF
FINANCIAL CONDITION AND RESULTS OF OPERATIONS


