Dollar Tree 2004 Annual Report Download - page 21
Download and view the complete annual report
Please find page 21 of the 2004 Dollar Tree annual report below. You can navigate through the pages in the report by either clicking on the pages listed below, or by using the keyword search tool below to find specific information within the annual report.-
 1
1 -
2
-
3
-
4
-
5
-
6
-
7
-
8
-
9
-
10
-
 11
11 -
 12
12 -
 13
13 -
 14
14 -
 15
15 -
 16
16 -
 17
17 -
 18
18 -
 19
19 -
 20
20 -
 21
21 -
 22
22 -
 23
23 -
 24
24 -
 25
25 -
 26
26 -
 27
27 -
 28
28 -
 29
29 -
 30
30 -
 31
31 -
32
-
33
-
34
-
35
-
36
-
37
-
38
-
39
-
40
-
41
-
42
-
43
-
44
-
45
-
46
-
47
-
48
-
49
-
50
-
51
-
52
-
53
-
54
 |
 |

DOLLAR TREE STORES, INC. • 2004 ANNUAL REPORT 17
MANAGEMENT’S DISCUSSION & ANALYSIS OF
FINANCIAL CONDITION AND RESULTS OF OPERATIONS
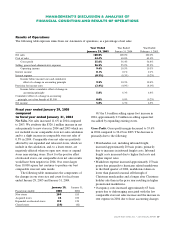
Results of Operations
The following table expresses items from our statements of operations, as a percentage of net sales:
Year Ended Year Ended Year Ended
January 29, 2005 January 31, 2004 February 1, 2003
Net sales 100.0% 100.0% 100.0%
Cost of sales 64.4% 63.6% 63.6%
Gross profit 35.6% 36.4% 36.4%
Selling, general and administrative expenses 26.2% 25.9% 25.9%
Operating income 9.4% 10.5% 10.5%
Interest income 0.1% 0.1% 0.1%
Interest expense (0.3%) (0.3%) (0.2%)
Income before income taxes and cumulative
effect of a change in accounting principle 9.2% 10.3% 10.4%
Provision for income taxes (3.4%) (4.0%) (4.0%)
Income before cumulative effect of change in
accounting principle 5.8% 6.3% 6.4%
Cumulative effect of a change in accounting
principle, net of tax benefit of $3,309 0.0% 0.0% (0.2%)
Net income 5.8% 6.3% 6.2%
Fiscal year ended January 29, 2005
compared
to fiscal year ended January 31, 2004
Net Sales. Net sales increased 11.6% in 2004 compared
to 2003. We attribute this $326.1 million increase in net
sales primarily to new stores in 2004 and 2003 which are
not included in our comparable store net sales calculation
and to a slight increase in comparable store net sales of
0.5% in 2004. Comparable store net sales are positively
affected by our expanded and relocated stores, which we
include in the calculation, and, to a lesser extent, are
negatively affected when we open new stores or expand
stores near existing stores. If not for the positive effect
of relocated stores, our comparable store net sales results
would have been negative in 2004. Our stores larger
than 10,000 square feet continue to produce our best
comparable store net sales results.
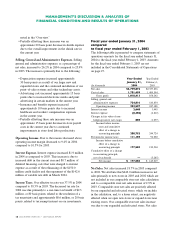
The following table summarizes the components of
the changes in our store size and count for fiscal years
ended January 29, 2005 and January 31, 2004.
January 29, January 31,
Fiscal years ended 2005 2004
New stores 209 183
Acquired stores 42 100
Expanded or relocated stores 129 124
Closed stores (29) (42)
Of the 3.6 million selling square foot increase in
2004, approximately 0.9 million in selling square feet
was added by expanding existing stores.
Gross Profit. Gross profit margin decreased to 35.6%
in 2004 compared to 36.4% in 2003. The decrease is
primarily due to the following:
• Merchandise cost, including inbound freight,
increased approximately 20 basis points, primarily
due to increases in inbound freight costs. Inbound
freight costs increased due to higher fuel costs and
higher import rates.
• Markdown expense increased approximately 15 basis
points due primarily to hurricane related markdowns
in the third quarter of 2004, markdowns taken on
lower than planned seasonal sell through of
Christmas merchandise and a longer after Christmas
holiday sale than in the prior year resulting in higher
promotional markdowns.
• Occupancy costs increased approximately 65 basis
points due to deleveraging associated with the low
comparable store net sales increase and the increase in
rent expense in 2004 due to lease accounting changes