BP 2009 Annual Report Download - page 8
Download and view the complete annual report
Please find page 8 of the 2009 BP annual report below. You can navigate through the pages in the report by either clicking on the pages listed below, or by using the keyword search tool below to find specific information within the annual report.-
 1
1 -
 2
2 -
 3
3 -
 4
4 -
 5
5 -
 6
6 -
 7
7 -
 8
8 -
 9
9 -
 10
10 -
 11
11 -
 12
12 -
 13
13 -
 14
14 -
 15
15 -
 16
16 -
 17
17 -
 18
18 -
 19
19 -
20
-
21
-
22
-
23
-
24
-
25
-
26
-
27
-
28
-
29
-
30
-
31
-
32
-
33
-
34
-
35
-
36
-
37
-
38
-
39
-
40
-
41
-
42
-
43
-
44
-
45
-
46
-
47
-
48
-
49
-
50
-
51
-
52
-
53
-
54
-
55
-
56
-
57
-
58
-
59
-
60
-
61
-
62
-
63
-
64
-
65
-
66
-
67
-
68
-
69
-
70
-
71
-
72
-
73
-
74
-
75
-
76
-
77
-
78
-
79
-
80
-
81
-
82
-
83
-
84
-
85
-
86
-
87
-
88
-
89
-
90
-
91
-
92
-
93
-
94
-
95
-
96
-
97
-
98
-
99
-
100
-
101
-
102
-
103
-
104
-
105
-
106
-
107
-
108
-
109
-
110
-
111
-
112
-
113
-
114
-
115
-
116
-
117
-
118
-
119
-
120
-
121
-
122
-
123
-
124
-
125
-
126
-
127
-
128
-
129
-
130
-
131
-
132
-
133
-
134
-
135
-
136
-
137
-
138
-
139
-
140
-
141
-
142
-
143
-
144
-
145
-
146
-
147
-
148
-
149
-
150
-
151
-
152
-
153
-
154
-
155
-
156
-
157
-
158
-
159
-
160
-
161
-
162
-
163
-
164
-
165
-
166
-
167
-
168
-
169
-
170
-
171
-
172
-
173
-
174
-
175
-
176
-
177
-
178
-
179
-
180
-
181
-
182
-
183
-
184
-
185
-
186
-
187
-
188
-
189
-
190
-
191
-
192
-
193
-
194
-
195
-
196
-
197
-
198
-
199
-
200
-
201
-
202
-
203
-
204
-
205
-
206
-
207
-
208
-
209
-
210
-
211
-
212
 |
 |

6
BP Annual Report and Accounts 2009
Business review
Group chief
executive’s review
Tony Hayward Group Chief Executive
26 February 2010
Highlights
• Progress on safe and reliable operations.
• Real momentum in growing our businesses.
• Continued focus on effi ciency and improvement.
Effi ciency,
momentum
and growth
2009 saw the continuation of diffi cult
economic conditions and a volatile energy
market, with rising demand for oil in
non-OECD countries failing to offset lower
levels of consumption in OECD countries.
Oil prices began the year at $36.55 per
barrel and recovered to $77.67 per barrel
in December. Refi ning margins and gas
prices fell sharply. Despite these diffi cult
conditions, a revitalized BP kept up its
momentum and delivered strong operating
and fi nancial results while continuing to
focus on safe and reliable operations.
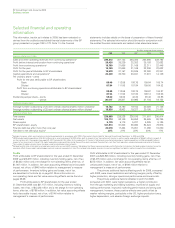
Replacement cost profi t for the year was
$14 billion, with a return on average capital
employeda of 11%.
a The return on average capital employed on a replacement
basis is the ratio of replacement cost profi t before interest
expense and minority interest but after tax, to the average
of opening and closing capital employed. Capital employed
is BP shareholders’ interest, plus fi nance debt and minority
interest.
Performance has been restored and
the group is competitive with the
industry once again, so what
priorities have you now set for BP?
Our priorities have remained absolutely
consistent – safety, people and performance
– and you can see the results of this focus
with improvements on all three fronts.
This year we have increased emphasis on
operational effi ciency, with a particular focus
on compliance and continuous improvement.
Achieving safe, reliable and compliant
operations is our number one priority and
the foundation stone for good business.
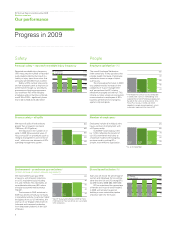
This year we achieved a reported recordable
injury frequency of 0.34, an improvement of
20% over 2008. In Refi ning and Marketing
reported major incidents have been reduced
by 90% since 2005. All our operated
refi neries and petrochemicals plants now
operate on the BP operating management
system (OMS), which governs how BP’s
operations, sites, projects and facilities are
managed. In Exploration and Production 47
of our 54 sites completed the transition to
OMS by the end of 2009, and I expect all BP
operations to be on OMS by the end of 2010.
This represents good progress and we must
remain absolutely vigilant.
Why are you putting such strong
emphasis on operational effi ciency?
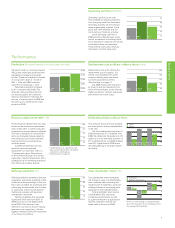
In 2009 we invested $20 billion in our
businesses and realized more than $4 billion
in cash costb savings, of which approximately
40% related to foreign exchange benefi ts
and lower fuel costs. Within an organization
of our scale, putting a long-term commitment
to effi ciency at the heart of the group is
essential to improving earnings, year after
year. Our challenge is to maintain a relentless
focus on continuous improvement, making
today better than yesterday, so that we
continue to drive the business forward
whatever the market conditions.
What does the focus on effi ciency
and continuous improvement mean
for your people?
Better performance starts and ends with the
actions of individuals and I want to thank our
employees for the commitment they showed
in 2009. Our performance speaks volumes
b
Cash costs are a subset of production and manufacturing
expenses plus distribution and administration expenses.
They represent the substantial majority of the expenses in
these line items but exclude associated non-operating items
and certain costs that are variable, primarily with volumes
(such as freight costs). They are the principal operating and
overhead costs that management considers to be most
directly under their control although they include certain
foreign exchange and commodity price effects.
about their motivation and skills. The results
from our 2009 employee survey confi rm
that employee morale is improving as our
operational performance improves.
We have placed greater emphasis on
organizational quality, which is about driving
continuous improvement in our leadership
and culture, skills and capability, and systems
and processes. We have redesigned the way
we manage and reward people to incentivize
performance. We are simplifying the
organization and freeing people to do their
jobs. We are placing particular value on deep
specialist skills and technical expertise, and
are developing and recruiting the excellent
professionals we need to ensure a
sustainable future for the group.
How is this focus translating into
performance in Exploration and
Production?
2009 was an outstanding year. Reported
production grew by 4% and unit production
costs were down by 12%. We are now the
largest producer in deepwater fi elds globally.
In the Gulf of Mexico we ramped up
production at Thunder Horse to more than
300,000 barrels of oil equivalent per day.
Production started from Atlantis Phase 2,
Dorado and King South. And in September
we announced the Tiber discovery, the
deepest oil and gas discovery well ever
drilled. These successes make us the largest
producer and leading resource holder in the
deepwater Gulf of Mexico.
During the year we also shipped
the fi rst cargo of liquefi ed natural gas (LNG)
from the Tangguh project in Indonesia, and
we brought fi rst gas onstream at Savonette,
Trinidad & Tobago, in record time. We also
gained access to new resource opportunities
in Iraq, Egypt, the Gulf of Mexico, Indonesia,
Jordan and onshore US. We entered Iraq
through a contract to expand production
from the Rumaila fi eld near Basra, one of the
largest oil fi elds in the world. Working with
partners China National Petroleum Company
(CNPC) and the Iraqi State Oil Marketing
Organization (SOMO), we intend to grow
production in Rumaila from approximately
1 million barrels per day to 2.85 million
barrels per day.
Overall, 2009 was the 17th
consecutive year of delivering reported
reserves replacement of more than
100%. Our success in adding reserves
and resources gives us confi dence in our
ability to grow oil and gas production.