BP 2009 Annual Report Download - page 155
Download and view the complete annual report
Please find page 155 of the 2009 BP annual report below. You can navigate through the pages in the report by either clicking on the pages listed below, or by using the keyword search tool below to find specific information within the annual report.-
 1
1 -
2
-
3
-
4
-
5
-
6
-
7
-
8
-
9
-
10
-
11
-
12
-
13
-
14
-
15
-
16
-
17
-
18
-
19
-
20
-
21
-
22
-
23
-
24
-
25
-
26
-
27
-
28
-
29
-
30
-
31
-
32
-
33
-
34
-
35
-
36
-
37
-
38
-
39
-
40
-
41
-
42
-
43
-
44
-
45
-
46
-
47
-
48
-
49
-
50
-
51
-
52
-
53
-
54
-
55
-
56
-
57
-
58
-
59
-
60
-
61
-
62
-
63
-
64
-
65
-
66
-
67
-
68
-
69
-
70
-
71
-
72
-
73
-
74
-
75
-
76
-
77
-
78
-
79
-
80
-
81
-
82
-
83
-
84
-
85
-
86
-
87
-
88
-
89
-
90
-
91
-
92
-
93
-
94
-
95
-
96
-
97
-
98
-
99
-
100
-
101
-
102
-
103
-
104
-
105
-
106
-
107
-
108
-
109
-
110
-
111
-
112
-
113
-
114
-
115
-
116
-
117
-
118
-
119
-
120
-
121
-
122
-
123
-
124
-
125
-
126
-
127
-
128
-
129
-
130
-
131
-
132
-
133
-
134
-
135
-
136
-
137
-
138
-
139
-
140
-
141
-
142
-
143
-
144
-
 145
145 -
 146
146 -
 147
147 -
 148
148 -
 149
149 -
 150
150 -
 151
151 -
 152
152 -
 153
153 -
 154
154 -
 155
155 -
 156
156 -
 157
157 -
 158
158 -
 159
159 -
 160
160 -
 161
161 -
 162
162 -
 163
163 -
 164
164 -
 165
165 -
166
-
167
-
168
-
169
-
170
-
171
-
172
-
173
-
174
-
175
-
176
-
177
-
178
-
179
-
180
-
181
-
182
-
183
-
184
-
185
-
186
-
187
-
188
-
189
-
190
-
191
-
192
-
193
-
194
-
195
-
196
-
197
-
198
-
199
-
200
-
201
-
202
-
203
-
204
-
205
-
206
-
207
-
208
-
209
-
210
-
211
-
212
 |
 |

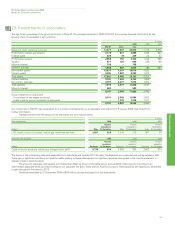
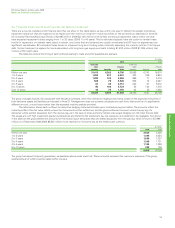
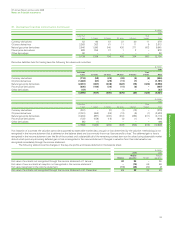
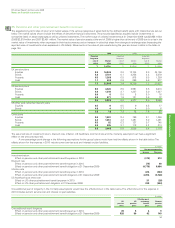
31. Derivative financial instruments continued
BP Annual Report and Accounts 2009
Notes on financial statements
Financial statements
153
$ million
2008
Less than Over
1 year 1-2 years 2-3 years 3-4 years 4-5 years 5 years Total
Currency derivatives 53 90 67 37 20 11 278
Oil price derivatives 3,368 353 61 11 11 9 3,813
Natural gas price derivatives 3,940 1,090 545 436 271 663 6,945
Power price derivatives 688 256 31 1 2 – 978
Other derivatives 90 – – – – – 90
8,139 1,789 704 485 304 683 12,104
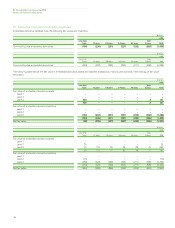
Derivative liabilities held for trading have the following fair values and maturities.
$ million
2009
Less than Over
1 year 1-2 years 2-3 years 3-4 years 4-5 years 5 years Total
Currency derivatives (110) (58) (20) (32) (4) (2) (226)
Oil price derivatives (1,083) (67) (29) (11) (1) – (1,191)
Natural gas price derivatives (2,381) (607) (248) (222) (78) (424) (3,960)
Power price derivatives (335) (109) (39) (11) (3) – (497)
Other derivatives (47) – – – – – (47)
(3,956) (841) (336) (276) (86) (426) (5,921)
$ million
2008
Less than Over
1 year 1-2 years 2-3 years 3-4 years 4-5 years 5 years Total
Currency derivatives (257) – (2) (1) (13) – (273)
Oil price derivatives (3,001) (458) (36) (18) (9) (1) (3,523)
Natural gas price derivatives (3,484) (987) (438) (310) (283) (611) (6,113)
Power price derivatives (722) (159) (18) (4) (1) – (904)
Other derivatives (95) (1) – – – – (96)
(7,559) (1,605) (494) (333) (306) (612) (10,909)
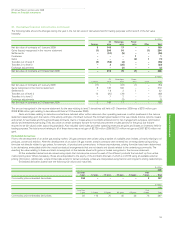
If at inception of a contract the valuation cannot be supported by observable market data, any gain or loss determined by the valuation methodology is not
recognized in the income statement but is deferred on the balance sheet and is commonly known as ‘day-one profit or loss’. This deferred gain or loss is
recognized in the income statement over the life of the contract until substantially all of the remaining contract term can be valued using observable market
data at which point any remaining deferred gain or loss is recognized in the income statement. Changes in valuation from this initial valuation are
recognized immediately through the income statement.
The following table shows the changes in the day-one profits and losses deferred on the balance sheet.
$ million
2009 2008
Natural Natural
Oil price gas price Oil price gas price
Fair value of contracts not recognized through the income statement at 1 January 32 83 – 36
Fair value of new contracts at inception not recognized in the income statement – (14) 66 49
Fair value recognized in the income statement (11) (36) (34) (2)
Fair value of contracts not recognized through the income statement at 31 December 21 33 32 83