BP 2009 Annual Report Download - page 176
Download and view the complete annual report
Please find page 176 of the 2009 BP annual report below. You can navigate through the pages in the report by either clicking on the pages listed below, or by using the keyword search tool below to find specific information within the annual report.-
 1
1 -
2
-
3
-
4
-
5
-
6
-
7
-
8
-
9
-
10
-
11
-
12
-
13
-
14
-
15
-
16
-
17
-
18
-
19
-
20
-
21
-
22
-
23
-
24
-
25
-
26
-
27
-
28
-
29
-
30
-
31
-
32
-
33
-
34
-
35
-
36
-
37
-
38
-
39
-
40
-
41
-
42
-
43
-
44
-
45
-
46
-
47
-
48
-
49
-
50
-
51
-
52
-
53
-
54
-
55
-
56
-
57
-
58
-
59
-
60
-
61
-
62
-
63
-
64
-
65
-
66
-
67
-
68
-
69
-
70
-
71
-
72
-
73
-
74
-
75
-
76
-
77
-
78
-
79
-
80
-
81
-
82
-
83
-
84
-
85
-
86
-
87
-
88
-
89
-
90
-
91
-
92
-
93
-
94
-
95
-
96
-
97
-
98
-
99
-
100
-
101
-
102
-
103
-
104
-
105
-
106
-
107
-
108
-
109
-
110
-
111
-
112
-
113
-
114
-
115
-
116
-
117
-
118
-
119
-
120
-
121
-
122
-
123
-
124
-
125
-
126
-
127
-
128
-
129
-
130
-
131
-
132
-
133
-
134
-
135
-
136
-
137
-
138
-
139
-
140
-
141
-
142
-
143
-
144
-
145
-
146
-
147
-
148
-
149
-
150
-
151
-
152
-
153
-
154
-
155
-
156
-
157
-
158
-
159
-
160
-
161
-
162
-
163
-
164
-
165
-
 166
166 -
 167
167 -
 168
168 -
 169
169 -
 170
170 -
 171
171 -
 172
172 -
 173
173 -
 174
174 -
 175
175 -
 176
176 -
 177
177 -
 178
178 -
 179
179 -
 180
180 -
 181
181 -
 182
182 -
 183
183 -
 184
184 -
 185
185 -
 186
186 -
187
-
188
-
189
-
190
-
191
-
192
-
193
-
194
-
195
-
196
-
197
-
198
-
199
-
200
-
201
-
202
-
203
-
204
-
205
-
206
-
207
-
208
-
209
-
210
-
211
-
212
 |
 |

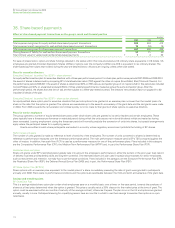
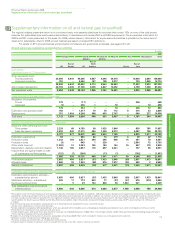
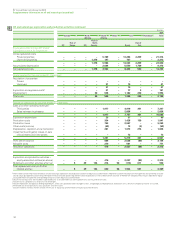
38. Share-based payments continued
EDIP- EDIP-
Shares granted in 2009 CPP EPP TSR BSC RSP DAB PSP
Number of equity instruments granted (million) 1.4 7.6 2.1 2.1 2.4 38.9 16.5
Weighted average fair value $9.76 $6.56 $2.74 $7.27 $8.76 $6.56 $8.32
Fair value measurement basis Monte Market Monte Market Market Market Monte
Carlo value Carlo value value value Carlo
MTPP- MTPP- EDIP- EDIP-
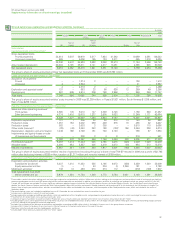
Shares granted in 2008 TSR FCF TSR RETaRSP DAB PSP
Number of equity instruments granted (million) 9.1 9.1 2.6 0.5 7.7 5.8 16.7
Weighted average fair value $5.07 $10.34 $4.55 $11.13 $8.83 $10.34 $12.89
Fair value measurement basis Monte Market Monte Market Market Market Monte
Carlo value Carlo value value value Carlo
MTPP- MTPP- EDIP- EDIP-
Shares granted in 2007 TSR FCF TSR LTLbRSP DAB PSP
Number of equity instruments granted (million) 9.4 8.5 4.5 0.5 7.7 4.4 14.8
Weighted average fair value $4.73 $10.02 $2.81 $9.92 $11.93 $10.02 $12.37
Fair value measurement basis Monte Market Monte Market Market Market Monte
Carlo value Carlo value value value Carlo
aEDIP – retention element.
bEDIP – long-term leadership element.
The group used a Monte Carlo simulation to determine the fair value of the TSR element of the 2009, 2008 and 2007 CPP, PSP, MTPP and EDIP plans.
In accordance with the rules of the plans the model simulates BP’s TSR and compares it against our principal strategic competitors over the three-year
period of the plans. The model takes into account the historic dividends, share price volatilities and covariances of BP and each comparator company to
produce a predicted distribution of relative share performance. This is applied to the reward criteria to give an expected value of the TSR element.
Accounting expense does not necessarily represent the actual value of share-based payments made to recipients, which are determined by the
remuneration committee according to established criteria.
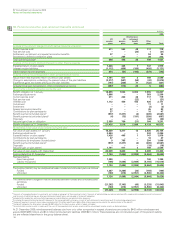
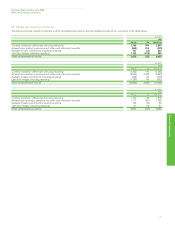
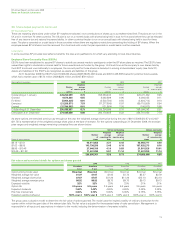
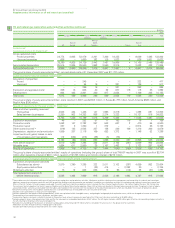
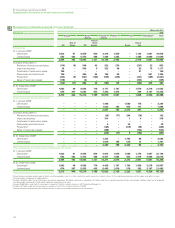
39. Employee costs and numbers
BP Annual Report and Accounts 2009
Notes on financial statements
174
$ million
Employee costs 2009 2008 2007
Wages and salariesa9,702 10,388 9,808
Social security costs 780 805 771
Share-based payments 521 508 428
Pension and other post-retirement benefit costs 1,213 579 504
12,216 12,280 11,511
Number of employees at 31 December 2009 2008 2007
Exploration and Production 21,500 21,400 21,800
Refining and Marketingb51,600 61,500 67,200
Other businesses and corporate 7,200 9,100 9,100
80,300 92,000 98,100
By geographical area
US 22,800 29,300 33,000
Non-USb57,500 62,700 65,100
80,300 92,000 98,100
2009 2008 2007
Average number of employees US Non-US Total US Non-US Total US Non-US Total
Exploration and Production 7,900 13,800 21,700 7,800 13,800 21,600 7,700 13,800 21,500
Refining and Marketing 14,700 40,700 55,400 21,600 43,400 65,000 23,400 43,900 67,300
Other businesses and corporate 2,300 5,800 8,100 2,600 6,500 9,100 2,500 5,900 8,400
24,900 60,300 85,200 32,000 63,700 95,700 33,600 63,600 97,200
aIncludes termination payments of $945 million (2008 $669 million and 2007 $422 million).
bIncludes 13,900 (2008 21,200 and 2007 24,500) service station staff.