BP 2009 Annual Report Download - page 159
Download and view the complete annual report
Please find page 159 of the 2009 BP annual report below. You can navigate through the pages in the report by either clicking on the pages listed below, or by using the keyword search tool below to find specific information within the annual report.-
 1
1 -
2
-
3
-
4
-
5
-
6
-
7
-
8
-
9
-
10
-
11
-
12
-
13
-
14
-
15
-
16
-
17
-
18
-
19
-
20
-
21
-
22
-
23
-
24
-
25
-
26
-
27
-
28
-
29
-
30
-
31
-
32
-
33
-
34
-
35
-
36
-
37
-
38
-
39
-
40
-
41
-
42
-
43
-
44
-
45
-
46
-
47
-
48
-
49
-
50
-
51
-
52
-
53
-
54
-
55
-
56
-
57
-
58
-
59
-
60
-
61
-
62
-
63
-
64
-
65
-
66
-
67
-
68
-
69
-
70
-
71
-
72
-
73
-
74
-
75
-
76
-
77
-
78
-
79
-
80
-
81
-
82
-
83
-
84
-
85
-
86
-
87
-
88
-
89
-
90
-
91
-
92
-
93
-
94
-
95
-
96
-
97
-
98
-
99
-
100
-
101
-
102
-
103
-
104
-
105
-
106
-
107
-
108
-
109
-
110
-
111
-
112
-
113
-
114
-
115
-
116
-
117
-
118
-
119
-
120
-
121
-
122
-
123
-
124
-
125
-
126
-
127
-
128
-
129
-
130
-
131
-
132
-
133
-
134
-
135
-
136
-
137
-
138
-
139
-
140
-
141
-
142
-
143
-
144
-
145
-
146
-
147
-
148
-
 149
149 -
 150
150 -
 151
151 -
 152
152 -
 153
153 -
 154
154 -
 155
155 -
 156
156 -
 157
157 -
 158
158 -
 159
159 -
 160
160 -
 161
161 -
 162
162 -
 163
163 -
 164
164 -
 165
165 -
 166
166 -
 167
167 -
 168
168 -
 169
169 -
170
-
171
-
172
-
173
-
174
-
175
-
176
-
177
-
178
-
179
-
180
-
181
-
182
-
183
-
184
-
185
-
186
-
187
-
188
-
189
-
190
-
191
-
192
-
193
-
194
-
195
-
196
-
197
-
198
-
199
-
200
-
201
-
202
-
203
-
204
-
205
-
206
-
207
-
208
-
209
-
210
-
211
-
212
 |
 |

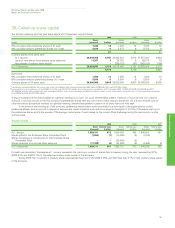
31. Derivative financial instruments continued
BP Annual Report and Accounts 2009
Notes on financial statements
Financial statements
157
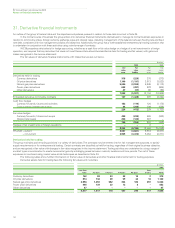
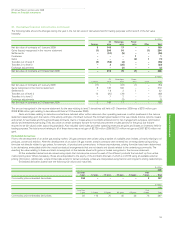
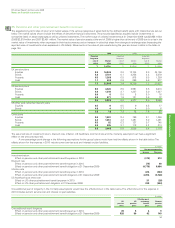
The following table shows the changes during the year in the net fair value of embedded derivatives within level 3 of the fair value hierarchy.
$ million
2009 2008
Commodity Commodity Interest
price price rate Total
Net fair value of contracts at 1 January (1,892) (2,146) (33) (2,179)
Settlements 221 414 38 452
Gains (losses) recognized in the income statementa535 (1,011) (5) (1,016)
Exchange adjustments (195) 851 – 851
Net fair value of contracts at 31 December (1,331) (1,892) – (1,892)
aThe amount for gains (losses) recognized in the income statement for 2009 includes a loss of $224 million arising as a result of refinements in the modelling and valuation methods used for these
contracts.
The amount recognized in the income statement for the year relating to level 3 embedded derivatives still held at 31 December 2009 was a
$347 million gain (2008 $985 million loss relating to embedded derivatives still held at 31 December 2008).
The fair value gain (loss) on embedded derivatives is shown below.
$ million
2009 2008 2007
Commodity price embedded derivatives 607 (106) –
Interest rate embedded derivatives –(5) (7)
Fair value gain (loss) 607 (111) (7)
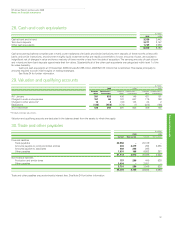
Cash flow hedges
At 31 December 2009, the group held currency forwards and futures contracts and cylinders that were being used to hedge the foreign currency risk
of highly probable forecast transactions, as well as cross-currency interest rate swaps to fix the US dollar interest rate and US dollar redemption value,
with matching critical terms on the currency leg of the swap with the underlying non-US dollar debt issuance. Note 24 outlines the management of risk
aspects for currency and interest rate risk. For cash flow hedges the group only claims hedge accounting for the intrinsic value on the currency with
any fair value attributable to time value taken immediately to the income statement. There were no highly probable transactions for which hedge
accounting has been claimed that have not occurred and no significant element of hedge ineffectiveness requiring recognition in the income
statement. For cash flow hedges the pre-tax amount removed from equity during the period and included in the income statement is a loss of
$366 million (2008 loss of $45 million and 2007 gain of $74 million). Of this, a loss of $332 million is included in production and manufacturing
expenses (2008 $1 million loss and 2007 $143 million gain) and a loss of $34 million is included in finance costs (2008 $44 million loss and 2007
$69 million loss). The amount removed from equity during the period and included in the carrying amount of non-financial assets was a loss of
$136 million (2008 $38 million gain and 2007 $40 million gain).
The amounts retained in equity at 31 December 2009 are expected to mature and affect the income statement by a $146 million gain in 2010,
a loss of $26 million in 2011 and a loss of $65 million in 2012 and beyond.
Fair value hedges
At 31 December 2009, the group held interest rate and cross-currency interest rate swap contracts as fair value hedges of the interest rate risk on
fixed rate debt issued by the group. The effectiveness of each hedge relationship is quantitatively assessed and demonstrated to continue to be highly
effective. The loss on the hedging derivative instruments taken to the income statement in 2009 was $98 million (2008 $2 million gain and 2007
$334 million gain) offset by a gain on the fair value of the finance debt of $117 million (2008 $20 million loss and 2007 $327 million loss).
The interest rate and cross-currency interest rate swaps have an average maturity of four to five years, (2008 three to four years) and are used
to convert sterling, euro, Swiss franc, Australian dollar, Japanese yen and Hong Kong dollar denominated borrowings into US dollar floating rate debt.
Note 24 outlines the group’s approach to interest rate risk management.
Hedges of net investments in foreign operations
The group held currency swap contracts as a hedge of a long-term investment in a UK subsidiary that expired in 2009. At 31 December 2008, the
hedge had a fair value of $2 million and the loss on the hedge recognized in equity in 2008 was $38 million (2007 $67 million loss). US dollars had been
sold forward for sterling purchased and matched the underlying liability with no significant ineffectiveness reflected in the income statement.