BP 2009 Annual Report Download - page 161
Download and view the complete annual report
Please find page 161 of the 2009 BP annual report below. You can navigate through the pages in the report by either clicking on the pages listed below, or by using the keyword search tool below to find specific information within the annual report.-
 1
1 -
2
-
3
-
4
-
5
-
6
-
7
-
8
-
9
-
10
-
11
-
12
-
13
-
14
-
15
-
16
-
17
-
18
-
19
-
20
-
21
-
22
-
23
-
24
-
25
-
26
-
27
-
28
-
29
-
30
-
31
-
32
-
33
-
34
-
35
-
36
-
37
-
38
-
39
-
40
-
41
-
42
-
43
-
44
-
45
-
46
-
47
-
48
-
49
-
50
-
51
-
52
-
53
-
54
-
55
-
56
-
57
-
58
-
59
-
60
-
61
-
62
-
63
-
64
-
65
-
66
-
67
-
68
-
69
-
70
-
71
-
72
-
73
-
74
-
75
-
76
-
77
-
78
-
79
-
80
-
81
-
82
-
83
-
84
-
85
-
86
-
87
-
88
-
89
-
90
-
91
-
92
-
93
-
94
-
95
-
96
-
97
-
98
-
99
-
100
-
101
-
102
-
103
-
104
-
105
-
106
-
107
-
108
-
109
-
110
-
111
-
112
-
113
-
114
-
115
-
116
-
117
-
118
-
119
-
120
-
121
-
122
-
123
-
124
-
125
-
126
-
127
-
128
-
129
-
130
-
131
-
132
-
133
-
134
-
135
-
136
-
137
-
138
-
139
-
140
-
141
-
142
-
143
-
144
-
145
-
146
-
147
-
148
-
149
-
150
-
 151
151 -
 152
152 -
 153
153 -
 154
154 -
 155
155 -
 156
156 -
 157
157 -
 158
158 -
 159
159 -
 160
160 -
 161
161 -
 162
162 -
 163
163 -
 164
164 -
 165
165 -
 166
166 -
 167
167 -
 168
168 -
 169
169 -
 170
170 -
 171
171 -
172
-
173
-
174
-
175
-
176
-
177
-
178
-
179
-
180
-
181
-
182
-
183
-
184
-
185
-
186
-
187
-
188
-
189
-
190
-
191
-
192
-
193
-
194
-
195
-
196
-
197
-
198
-
199
-
200
-
201
-
202
-
203
-
204
-
205
-
206
-
207
-
208
-
209
-
210
-
211
-
212
 |
 |

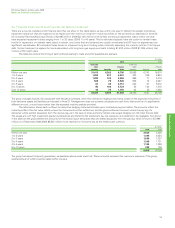
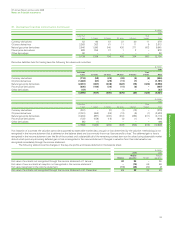
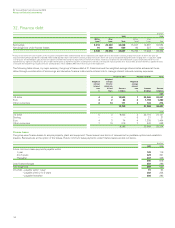
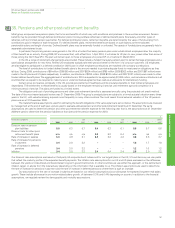
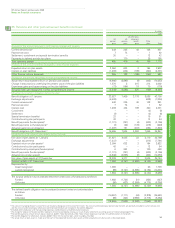
32. Finance debt continued
Fair values
The estimated fair value of finance debt is shown in the table below together with the carrying amount as reflected in the balance sheet.
Long-term borrowings in the table below include the portion of debt that matures in the year from 31 December 2009, whereas in the balance
sheet the amount would be reported within current liabilities.
The carrying amount of the group’s short-term borrowings, comprising mainly commercial paper, bank loans, overdrafts and US Industrial
Revenue/Municipal Bonds, approximates their fair value. The fair value of the group’s long-term borrowings and finance lease obligations is estimated
using quoted prices or, where these are not available, discounted cash flow analyses based on the group’s current incremental borrowing rates for
similar types and maturities of borrowing.
$ million
2009 2008
Carrying Carrying
Fair value amount Fair value amount
Short-term borrowings 5,144 5,144 9,913 9,913
Long-term borrowings 29,918 28,894 23,239 22,671
Net obligations under finance leases 599 589 638 620
Total finance debt 35,661 34,627 33,790 33,204
See Note 24 for further information.
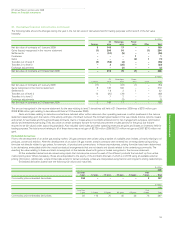
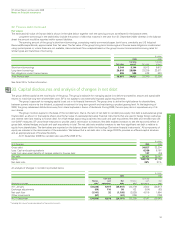
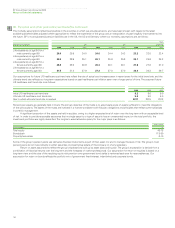
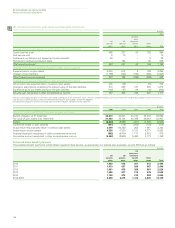
33. Capital disclosures and analysis of changes in net debt
BP Annual Report and Accounts 2009
Notes on financial statements
Financial statements
159
The group defines capital as the total equity of the group. The group’s objective for managing capital is to deliver competitive, secure and sustainable
returns to maximize long-term shareholder value. BP is not subject to any externally-imposed capital requirements.
The group’s approach to managing capital is set out in its financial framework. The group aims to strike the right balance for shareholders,
between current returns via the dividend, sustained investment for long-term growth and maintaining a prudent gearing level. At the beginning of
2008, the group rebalanced distributions away from share buybacks in favour of dividends. During 2009, the company did not repurchase any of its
own shares.
The group monitors capital on the basis of the net debt ratio, that is, the ratio of net debt to net debt plus equity. Net debt is calculated as gross
finance debt, as shown in the balance sheet, plus the fair value of associated derivative financial instruments that are used to hedge foreign exchange
and interest rate risks relating to finance debt, for which hedge accounting is claimed, less cash and cash equivalents. Net debt and net debt ratio are
non-GAAP measures. BP uses these measures to provide useful information to investors. Net debt enables investors to see the economic effect of
gross debt, related hedges and cash and cash equivalents in total. The net debt ratio enables investors to see how significant net debt is relative to
equity from shareholders. The derivatives are reported on the balance sheet within the headings ‘Derivative financial instruments’. All components of
equity are included in the denominator of the calculation. We believe that a net debt ratio in the range 20-30% provides an efficient capital structure
and an appropriate level of financial flexibility.
At 31 December 2009 the net debt ratio was 20% (2008 21%).
$ million
At 31 December 2009 2008
Gross debt 34,627 33,204
Less: Cash and cash equivalents 8,339 8,197
Less: Fair value asset (liability) of hedges related to finance debt 127 (34)
Net debt 26,161 25,041
Equity 102,113 92,109
Net debt ratio 20% 21%
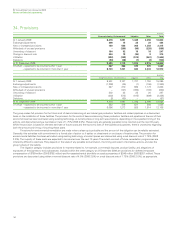
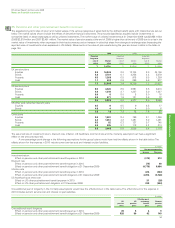
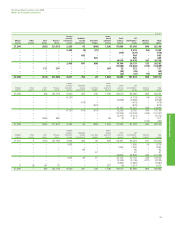
An analysis of changes in net debt is provided below.
$ million
2009 2008
Cash and Cash and
Finance cash Net Finance cash Net
Movement in net debt debt aequivalents debt debtaequivalents debt
At 1 January (33,238) 8,197 (25,041) (30,379) 3,562 (26,817)
Exchange adjustments (60) 110 50 102 (184) (82)
Net cash flow (1,141) 32 (1,109) (2,825) 4,819 1,994
Other movements (61) – (61) (136) – (136)
At 31 December (34,500) 8,339 (26,161) (33,238) 8,197 (25,041)
aIncluding fair value of associated derivative financial instruments.