BP 2009 Annual Report Download - page 204
Download and view the complete annual report
Please find page 204 of the 2009 BP annual report below. You can navigate through the pages in the report by either clicking on the pages listed below, or by using the keyword search tool below to find specific information within the annual report.-
 1
1 -
 2
2 -
 3
3 -
 4
4 -
 5
5 -
 6
6 -
 7
7 -
 8
8 -
 9
9 -
 10
10 -
 11
11 -
 12
12 -
 13
13 -
 14
14 -
 15
15 -
 16
16 -
 17
17 -
 18
18 -
 19
19 -
 20
20 -
 21
21 -
 22
22 -
 23
23 -
 24
24 -
 25
25 -
 26
26 -
 27
27 -
 28
28 -
 29
29 -
 30
30 -
 31
31 -
 32
32 -
 33
33 -
 34
34 -
 35
35 -
 36
36 -
 37
37 -
 38
38 -
 39
39 -
 40
40 -
 41
41 -
 42
42 -
 43
43 -
 44
44 -
 45
45 -
 46
46 -
 47
47 -
 48
48 -
 49
49 -
 50
50 -
 51
51 -
 52
52 -
 53
53 -
 54
54 -
 55
55 -
 56
56 -
 57
57 -
 58
58 -
 59
59 -
 60
60 -
 61
61 -
 62
62 -
 63
63 -
 64
64 -
 65
65 -
 66
66 -
 67
67 -
 68
68 -
 69
69 -
 70
70 -
 71
71 -
 72
72 -
 73
73 -
 74
74 -
 75
75 -
 76
76 -
 77
77 -
 78
78 -
 79
79 -
 80
80 -
 81
81 -
 82
82 -
 83
83 -
 84
84 -
 85
85 -
 86
86 -
 87
87 -
 88
88 -
 89
89 -
 90
90 -
 91
91 -
 92
92 -
 93
93 -
 94
94 -
 95
95 -
 96
96 -
 97
97 -
 98
98 -
 99
99 -
 100
100 -
 101
101 -
 102
102 -
 103
103 -
 104
104 -
 105
105 -
 106
106 -
 107
107 -
 108
108 -
 109
109 -
 110
110 -
 111
111 -
 112
112 -
 113
113 -
 114
114 -
 115
115 -
 116
116 -
 117
117 -
 118
118 -
 119
119 -
 120
120 -
 121
121 -
 122
122 -
 123
123 -
 124
124 -
 125
125 -
 126
126 -
 127
127 -
 128
128 -
 129
129 -
 130
130 -
 131
131 -
 132
132 -
 133
133 -
 134
134 -
 135
135 -
 136
136 -
 137
137 -
 138
138 -
 139
139 -
 140
140 -
 141
141 -
 142
142 -
 143
143 -
 144
144 -
 145
145 -
 146
146 -
 147
147 -
 148
148 -
 149
149 -
 150
150 -
 151
151 -
 152
152 -
 153
153 -
 154
154 -
 155
155 -
 156
156 -
 157
157 -
 158
158 -
 159
159 -
 160
160 -
 161
161 -
 162
162 -
 163
163 -
 164
164 -
 165
165 -
 166
166 -
 167
167 -
 168
168 -
 169
169 -
 170
170 -
 171
171 -
 172
172 -
 173
173 -
 174
174 -
 175
175 -
 176
176 -
 177
177 -
 178
178 -
 179
179 -
 180
180 -
 181
181 -
 182
182 -
 183
183 -
 184
184 -
 185
185 -
 186
186 -
 187
187 -
 188
188 -
 189
189 -
 190
190 -
 191
191 -
 192
192 -
 193
193 -
 194
194 -
 195
195 -
 196
196 -
 197
197 -
 198
198 -
 199
199 -
 200
200 -
 201
201 -
 202
202 -
 203
203 -
 204
204 -
 205
205 -
 206
206 -
 207
207 -
 208
208 -
 209
209 -
 210
210 -
 211
211 -
 212
212
 |
 |

BP Annual Report and Accounts 2009
Parent company financial statements of BP p.l.c.
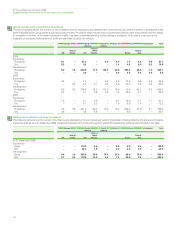
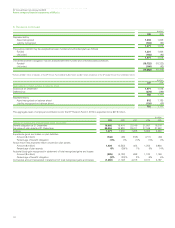
6. Pensions continued
202
$ million
2009 2008
Represented by
Asset recognized 1,234 1,608
Liability recognized (163) (92)
1,071 1,516
The surplus (deficit) may be analysed between funded and unfunded plans as follows
Funded 1,231 1,608
Unfunded (160) (92)
1,071 1,516
The defined benefit obligation may be analysed between funded and unfunded plans as follows
Fundeda(19,722) (15,322)
Unfunded (160) (92)
(19,882) (15,414)
aReflects $19,661 million of liabilities of the BP Pension Fund (2008 $15,280 million) and $61 million of liabilities of the BP Global Pension Trust (2008 $42 million).
$ million
2009 2008
Reconciliation of plan surplus to balance sheet
Surplus at 31 December 1,071 1,516
Deferred tax (279) (399)
792 1,117
Represented by
Asset recognized on balance sheet 912 1,185
Liability recognized on balance sheet (120) (68)
792 1,117
The aggregate level of employer contributions into the BP Pension Fund in 2010 is expected to be $419 million.
$ million
2009 2008 2007 2006 2005
History of surplus and of experience gains and losses
Benefit obligation at 31 December 19,882 15,414 22,146 21,507 18,316
Fair value of plan assets at 31 December 20,953 16,930 29,411 27,169 21,542
Surplus 1,071 1,516 7,265 5,662 3,226
Experience gains and losses on plan liabilities
Amount ($ million) (146) (65) (155) (211) (66)
Percentage of benefit obligation (1)% 0% (1)% (1)% 0%
Actual return less expected return on pension plan assets
Amount ($ million) 1,634 (6,533) 404 1,252 2,946
Percentage of plan assets 8% (39)% 1% 5% 14%
Actuarial (loss) gain recognized in statement of total recognized gains and losses
Amount ($ million) (585) (5,122) 698 1,120 1,159
Percentage of benefit obligation (3)% (33)% 3% 6% 6%
Cumulative amount recognized in statement of total recognized gains and losses (1,692) (1,107) 4,015 3,317 2,197
