BP 2009 Annual Report Download - page 137
Download and view the complete annual report
Please find page 137 of the 2009 BP annual report below. You can navigate through the pages in the report by either clicking on the pages listed below, or by using the keyword search tool below to find specific information within the annual report.-
 1
1 -
2
-
3
-
4
-
5
-
6
-
7
-
8
-
9
-
10
-
11
-
12
-
13
-
14
-
15
-
16
-
17
-
18
-
19
-
20
-
21
-
22
-
23
-
24
-
25
-
26
-
27
-
28
-
29
-
30
-
31
-
32
-
33
-
34
-
35
-
36
-
37
-
38
-
39
-
40
-
41
-
42
-
43
-
44
-
45
-
46
-
47
-
48
-
49
-
50
-
51
-
52
-
53
-
54
-
55
-
56
-
57
-
58
-
59
-
60
-
61
-
62
-
63
-
64
-
65
-
66
-
67
-
68
-
69
-
70
-
71
-
72
-
73
-
74
-
75
-
76
-
77
-
78
-
79
-
80
-
81
-
82
-
83
-
84
-
85
-
86
-
87
-
88
-
89
-
90
-
91
-
92
-
93
-
94
-
95
-
96
-
97
-
98
-
99
-
100
-
101
-
102
-
103
-
104
-
105
-
106
-
107
-
108
-
109
-
110
-
111
-
112
-
113
-
114
-
115
-
116
-
117
-
118
-
119
-
120
-
121
-
122
-
123
-
124
-
125
-
126
-
 127
127 -
 128
128 -
 129
129 -
 130
130 -
 131
131 -
 132
132 -
 133
133 -
 134
134 -
 135
135 -
 136
136 -
 137
137 -
 138
138 -
 139
139 -
 140
140 -
 141
141 -
 142
142 -
 143
143 -
 144
144 -
 145
145 -
 146
146 -
 147
147 -
148
-
149
-
150
-
151
-
152
-
153
-
154
-
155
-
156
-
157
-
158
-
159
-
160
-
161
-
162
-
163
-
164
-
165
-
166
-
167
-
168
-
169
-
170
-
171
-
172
-
173
-
174
-
175
-
176
-
177
-
178
-
179
-
180
-
181
-
182
-
183
-
184
-
185
-
186
-
187
-
188
-
189
-
190
-
191
-
192
-
193
-
194
-
195
-
196
-
197
-
198
-
199
-
200
-
201
-
202
-
203
-
204
-
205
-
206
-
207
-
208
-
209
-
210
-
211
-
212
 |
 |

BP Annual Report and Accounts 2009
Notes on financial statements
Financial statements
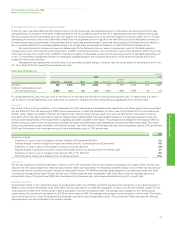
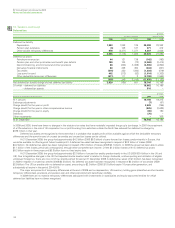
12. Operating leases continued
The group enters into operating leases of ships, plant and machinery, commercial vehicles and land and buildings. Typical durations of the leases
are as follows:
Ye a r s
Ships up to 15
Plant and machinery up to 10
Commercial vehicles up to 15
Land and buildings up to 40
The group has entered into a number of structured operating leases for ships and in most cases the lease rental payments vary with market interest
rates. The variable portion of the lease payments above or below the amount based on the market interest rate prevailing at inception of the lease is
treated as contingent rental expense. The group also routinely enters into bareboat charters, time-charters and spot-charters for ships on standard
industry terms.
The most significant items of plant and machinery hired under operating leases are drilling rigs used in the Exploration and Production segment.
At 31 December 2009 the future minimum lease payments relating to drilling rigs amounted to $4,919 million (2008 $5,531 million). In some cases,
drilling rig lease rental rates are adjusted periodically to market rates that are influenced by oil prices and may be significantly different from the rates at
the inception of the lease. Differences between the rate paid and rate at inception of the lease are treated as contingent rental expense.
Commercial vehicles hired under operating leases are primarily railcars. Retail service station sites and office accommodation are the main
items in the land and buildings category.
The terms and conditions of these operating leases do not impose any significant financial restrictions on the group. Some of the leases of
ships and buildings allow for renewals at BP’s option.
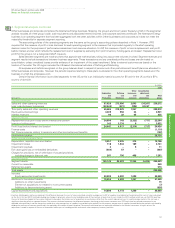
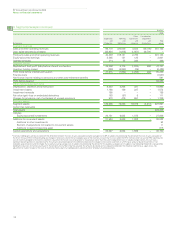
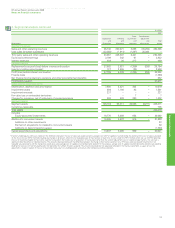
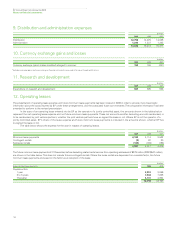
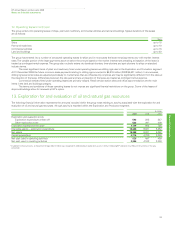
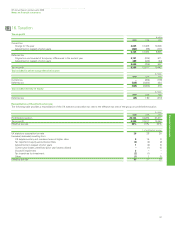
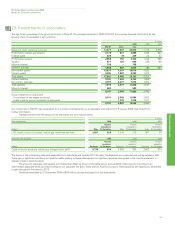
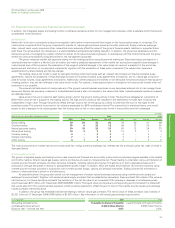
13. Exploration for and evaluation of oil and natural gas resources
135
The following financial information represents the amounts included within the group totals relating to activity associated with the exploration for and
evaluation of oil and natural gas resources. All such activity is recorded within the Exploration and Production segment.
$ million
2009 2008 2007
Exploration and evaluation costs
Exploration expenditure written off 593 385 347
Other exploration costs 523 497 409
Exploration expense for the yeara1,116 882 756
Intangible assets – exploration expenditure 10,388 9,031 5,252
Net assets 10,388 9,031 5,252
Capital expenditure 2,715 4,780 2,000
Net cash used in operating activities 523 497 409
Net cash used in investing activities 3,306 4,163 2,000
aIn addition to these amounts, an impairment charge of $210 million was recognized in 2008 relating to exploration assets in Vietnam following BP’s decision to withdraw from activities in the area
concerned.