BP 2009 Annual Report Download - page 184
Download and view the complete annual report
Please find page 184 of the 2009 BP annual report below. You can navigate through the pages in the report by either clicking on the pages listed below, or by using the keyword search tool below to find specific information within the annual report.
BP Annual Report and Accounts 2009
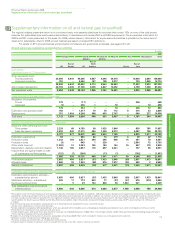
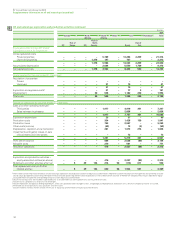
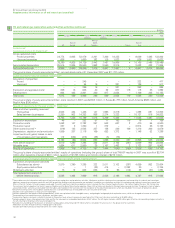
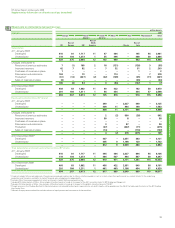
Supplementary information on oil and natural gas (unaudited)
Oil and natural gas exploration and production activities continued
182
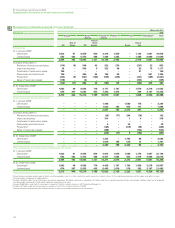
$ million
2007
Europe North South Africa Asia Australasia Total
America America
Rest of
Rest of North Rest of
UK Europe US America Russia Asia
Subsidiariesa
Capitalized costs at 31 Decemberb
Gross capitalized costs
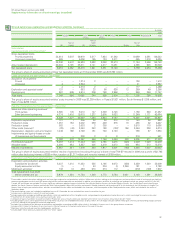
Proved properties 34,774 4,925 53,079 3,261 7,366 18,333 – 9,629 1,495 132,862
Unproved properties 606 – 1,660 182 115 1,533 4 536 1,001 5,637
35,380 4,925 54,739 3,443 7,481 19,866 4 10,165 2,496 138,499
Accumulated depreciation 25,515 2,925 25,500 1,968 3,560 8,315 – 3,638 423 71,844
Net capitalized costs 9,865 2,000 29,239 1,475 3,921 11,551 4 6,527 2,073 66,655
The group’s share of equity-accounted entities’ net capitalized costs at 31 December 2007 was $11,787 million.
Costs incurred for the year ended 31 Decemberb
Acquisition of propertiesc
Proved – – 245 ––––232 – 477
Unproved – – 54 16 – 321 – 126 – 517
– – 299 16 – 321 – 358 – 994
Exploration and appraisal costsd209 16 646 40 32 677 119 118 35 1,892
Development 804 443 3,861 240 817 2,634 – 1,109 245 10,153
Total costs 1,013 459 4,806 296 849 3,632 119 1,585 280 13,039
The group’s share of equity-accounted entities’ costs incurred in 2007 was $2,552 million: in Russia $1,787 million, South America $569 million, and
Rest of Asia $196 million.
Results of operations for the year ended 31 December
Sales and other operating revenuese
Third parties 4,503 434 1,436 147 1,995 2,219 – 1,388 681 12,803
Sales between businesses 2,260 902 14,353 868 2,274 3,223 – 10,137 816 34,833
6,763 1,336 15,789 1,015 4,269 5,442 – 11,525 1,497 47,636
Exploration expenditure 46 – 252 57 77 183 116 18 7 756
Production costs 1,658 147 2,782 267 503 637 2 470 64 6,530
Production taxesf227 3 1,260 1 272 – – 3,914 56 5,733
Other costs (income)fg (419) 123 2,505 237 158 224j169 1,316 366 4,679
Depreciation, depletion and amortization 1,569 207 2,118 169 653 1,372 – 1,148 52 7,288
Impairments and (gains) losses on sale
of businesses and fixed assets 112 (534) (413) (38) (5) (76) – – – (954)
3,193 (54) 8,504 693 1,658 2,340 287 6,866 545 24,032
Profit before taxationh3,570 1,390 7,285 322 2,611 3,102 (287) 4,659 952 23,604
Allocable taxes 1,664 611 2,560 35 1,167 1,462 3 1,133 267 8,902
Results of operations 1,906 779 4,725 287 1,444 1,640 (290) 3,526 685 14,702
The group’s share of equity-accounted entities’ results of operations (including the group’s share of total TNK-BP results) in 2007 was a profit of $2,704
million after deducting interest of $401 million, taxation of $1,355 million and minority interest of $215 million.
Exploration and Production segment replacement cost profit before interest and tax
Exploration and production activities
Subsidiaries (as above) 3,570 1,390 7,285 322 2,611 3,102 (287) 4,659 952 23,604
Equity-accounted entities – – 1 (33) 414 – 2,292 30 – 2,704
Midstream activitiesi15 12 643 626 13 96 (112) 38 (37) 1,294
Total replacement cost profit
before interest and tax 3,585 1,402 7,929 915 3,038 3,198 1,893 4,727 915 27,602
aThese tables contain information relating to oil and natural gas exploration and production activities. Midstream activities relating to the management and ownership of crude oil and natural gas
pipelines, processing and export terminals and LNG processing facilities and transportation are excluded. In addition, our midstream activities of marketing and trading of natural gas, power and
NGLs in the US, Canada, UK and Europe are excluded. The most significant midstream pipeline interests include the Trans-Alaska Pipeline System, the Forties Pipeline System, the Central Area
Transmission System pipeline, the South Caucasus Pipeline and the Baku-Tbilisi-Ceyhan pipeline. Major LNG activities are located in Trinidad, Indonesia and Australia. The group’s share of equity-
accounted entities’ activities are excluded from the tables and included in the footnotes with the exception of the Abu Dhabi operations which are included in the results of operations above.
bDecommissioning assets are included in capitalized costs at 31 December but are excluded from costs incurred for the year.
cIncludes costs capitalized as a result of asset exchanges.
dIncludes exploration and appraisal drilling expenditures, which are capitalized within intangible assets, and geological and geophysical exploration costs, which are charged to income as incurred.
ePresented net of transportation costs, purchases and sales taxes.
fComparative figures have been restated to include in Production taxes amounts previously reported within Other costs (income) amounting to $1,690 million.
gIncludes property taxes, other government take and the fair value gain on embedded derivatives of $47 million. The UK region includes a $409 million gain offset by corresponding charges primarily in
the US, relating to the group self-insurance programme.
hExcludes the unwinding of the discount on provisions and payables amounting to $179 million which is included in finance costs in the group income statement.
iMidstream activities exclude inventory holding gains and losses.
jIncludes $24 million previously reported within the ‘Other’ region.


