BP 2009 Annual Report Download - page 169
Download and view the complete annual report
Please find page 169 of the 2009 BP annual report below. You can navigate through the pages in the report by either clicking on the pages listed below, or by using the keyword search tool below to find specific information within the annual report.-
 1
1 -
2
-
3
-
4
-
5
-
6
-
7
-
8
-
9
-
10
-
11
-
12
-
13
-
14
-
15
-
16
-
17
-
18
-
19
-
20
-
21
-
22
-
23
-
24
-
25
-
26
-
27
-
28
-
29
-
30
-
31
-
32
-
33
-
34
-
35
-
36
-
37
-
38
-
39
-
40
-
41
-
42
-
43
-
44
-
45
-
46
-
47
-
48
-
49
-
50
-
51
-
52
-
53
-
54
-
55
-
56
-
57
-
58
-
59
-
60
-
61
-
62
-
63
-
64
-
65
-
66
-
67
-
68
-
69
-
70
-
71
-
72
-
73
-
74
-
75
-
76
-
77
-
78
-
79
-
80
-
81
-
82
-
83
-
84
-
85
-
86
-
87
-
88
-
89
-
90
-
91
-
92
-
93
-
94
-
95
-
96
-
97
-
98
-
99
-
100
-
101
-
102
-
103
-
104
-
105
-
106
-
107
-
108
-
109
-
110
-
111
-
112
-
113
-
114
-
115
-
116
-
117
-
118
-
119
-
120
-
121
-
122
-
123
-
124
-
125
-
126
-
127
-
128
-
129
-
130
-
131
-
132
-
133
-
134
-
135
-
136
-
137
-
138
-
139
-
140
-
141
-
142
-
143
-
144
-
145
-
146
-
147
-
148
-
149
-
150
-
151
-
152
-
153
-
154
-
155
-
156
-
157
-
158
-
 159
159 -
 160
160 -
 161
161 -
 162
162 -
 163
163 -
 164
164 -
 165
165 -
 166
166 -
 167
167 -
 168
168 -
 169
169 -
 170
170 -
 171
171 -
 172
172 -
 173
173 -
 174
174 -
 175
175 -
 176
176 -
 177
177 -
 178
178 -
 179
179 -
180
-
181
-
182
-
183
-
184
-
185
-
186
-
187
-
188
-
189
-
190
-
191
-
192
-
193
-
194
-
195
-
196
-
197
-
198
-
199
-
200
-
201
-
202
-
203
-
204
-
205
-
206
-
207
-
208
-
209
-
210
-
211
-
212
 |
 |

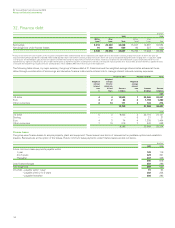
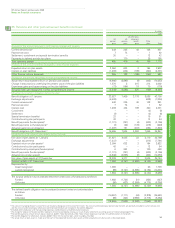
36. Called-up share capital
BP Annual Report and Accounts 2009
Notes on financial statements
Financial statements
167
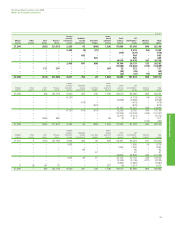
The allotted, called-up and fully paid share capital at 31 December was as follows:
2009 2008 2007
Shares Shares Shares
Issued (thousand) $ million (thousand) $ million (thousand) $ million
8% cumulative first preference shares of £1 each 7,233 12 7,233 12 7,233 12
9% cumulative second preference shares of £1 each 5,473 9 5,473 9 5,473 9
21 21 21
Ordinary shares of 25 cents each
At 1 January 20,618,458 5,155 20,863,424 5,216 21,457,301 5,364
Issue of new shares for employee share schemesa11,207 3 24,791 6 69,273 18
Repurchase of ordinary share capitalb– – (269,757) (67) (663,150) (166)
At 31 December 20,629,665 5,158 20,618,458 5,155 20,863,424 5,216
5,179 5,176 5,237
Authorized
8% cumulative first preference shares of £1 each 7,250 12 7,250 12 7,250 12
9% cumulative second preference shares of £1 each 5,500 9 5,500 9 5,500 9
Ordinary shares of 25 cents each 36,000,000 9,000 36,000,000 9,000 36,000,000 9,000
aConsideration received relating to the issue of new shares for employee share schemes amounted to $84 million (2008 $180 million and 2007 $492 million).
bPurchased for a total consideration of nil (2008 $2,914 million and 2007 $7,497 million), all of which were for cancellation. At 31 December 2009, 112,803,287 (2008 150,444,408 and 2007
150,966,096) ordinary shares bought back were awaiting cancellation. These shares have been excluded from ordinary shares in issue shown above. Transaction costs of share repurchases amounted
to nil (2008 $16 million and 2007 $40 million).
Voting on substantive resolutions tabled at a general meeting is on a poll. On a poll, shareholders present in person or by proxy have two votes for
every £5 in nominal amount of the first and second preference shares held and one vote for every ordinary share held. On a show-of-hands vote on
other resolutions (procedural matters) at a general meeting, shareholders present in person or by proxy have one vote each.
In the event of the winding up of the company, preference shareholders would be entitled to a sum equal to the capital paid up on the
preference shares, plus an amount in respect of accrued and unpaid dividends and a premium equal to the higher of (i) 10% of the capital paid up on
the preference shares and (ii) the excess of the average market price of such shares on the London Stock Exchange during the previous six months
over par value.
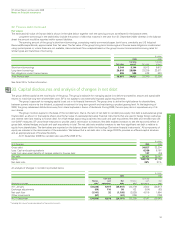
Treasury shares
2009 2008 2007
Shares Nominal value Shares Nominal value Shares Nominal value
(thousand) $ million (thousand) $ million (thousand) $ million
At 1 January 1,888,151 472 1,940,639 485 1,946,805 487
Shares gifted to the Employee Share Ownership Plans (1,265) (1) (10,000) (2) (1,700) –
Shares transferred at market price to the Employee Share
Ownership Plans – – (20,000) (5) – –
Shares re-issued to employee share schemes (17,109) (4) (22,488) (6) (4,466) (2)
At 31 December 1,869,777 467 1,888,151 472 1,940,639 485
For each year presented, the balance at 1 January represents the maximum number of shares held in treasury during the year, representing 9.2%
(2008 9.3% and 2007 9.1%) of the called-up ordinary share capital of the company.
During 2009, the movement in treasury shares represented less than 0.1% (2008 0.25% and 2007 less than 0.1%) of the ordinary share capital
of the company.